


GNSS Solutions
GPS position time series and velocities : Latest ULR solution
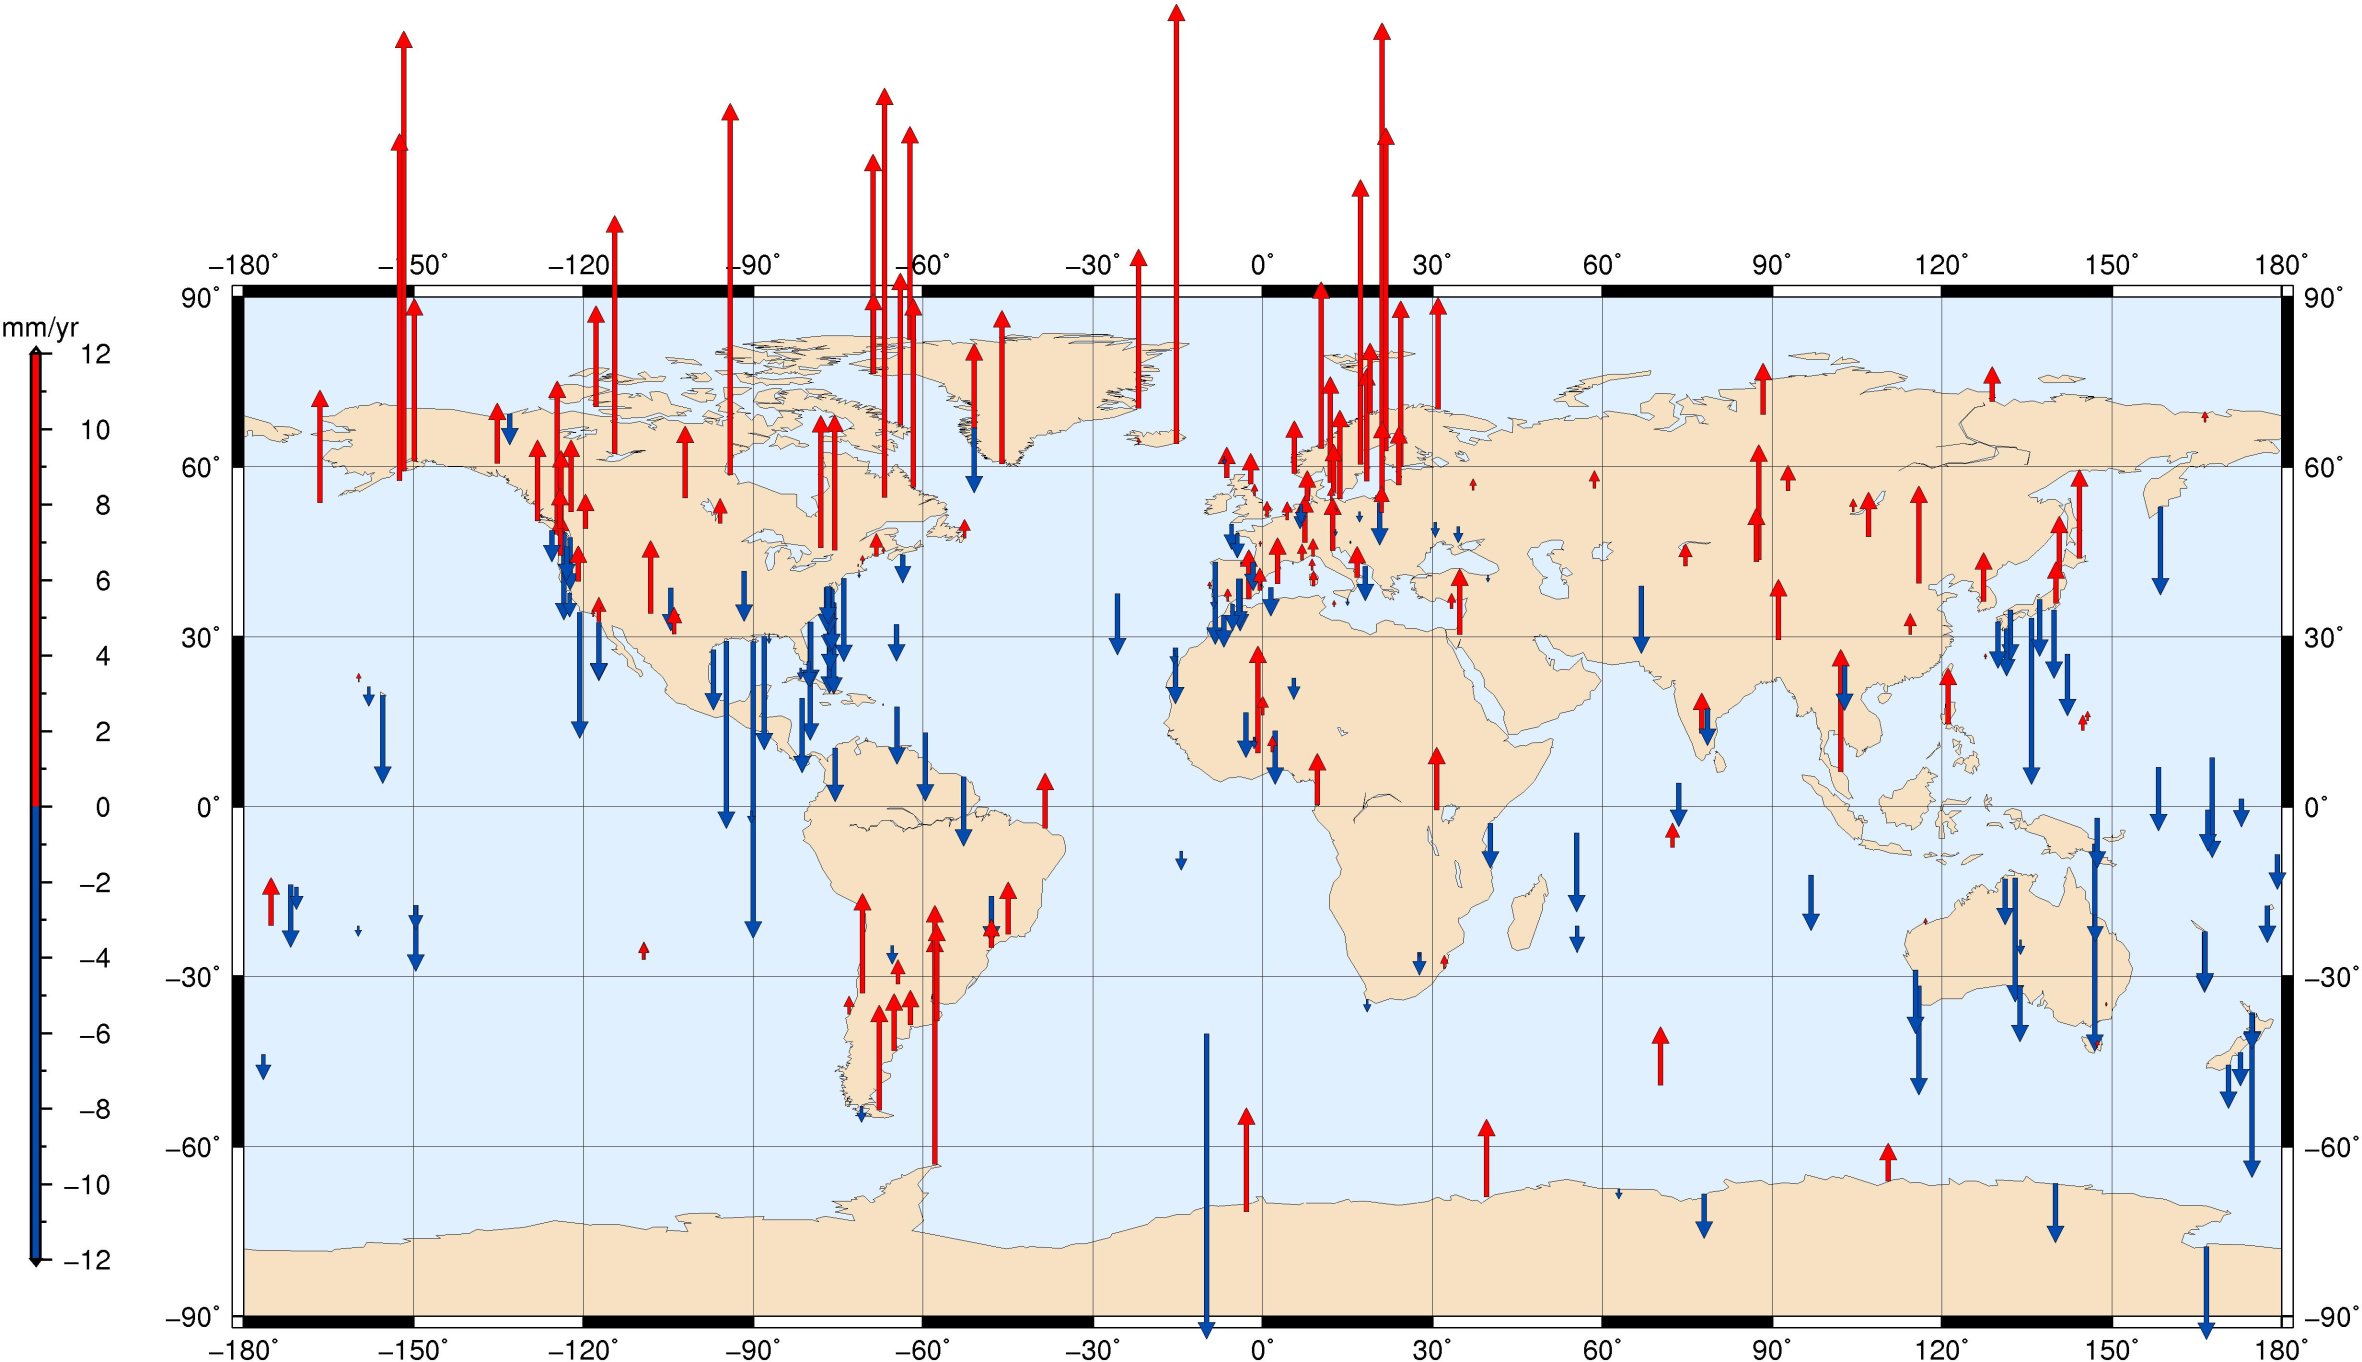
Several GPS solutions have been produced so far by the ULR analysis centre consortium as new analyses strategies were devised (models, parameterization,...). The latest solution is called ULR5. Its vertical velocity field is submitted in Global and Planetary Change. It is expressed in ITRF2008 using 16 years of GPS data.
-
- Main features
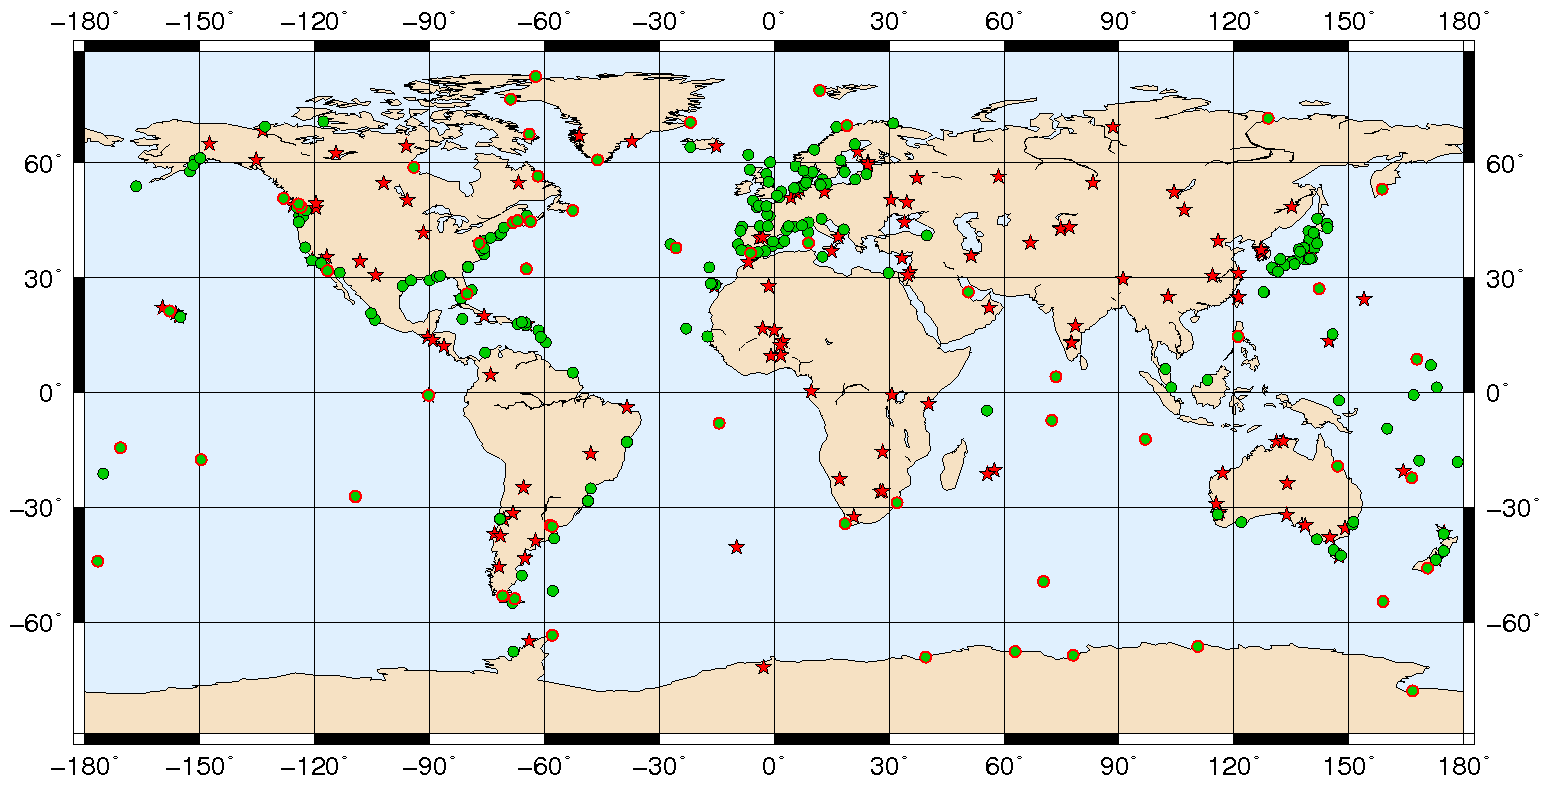
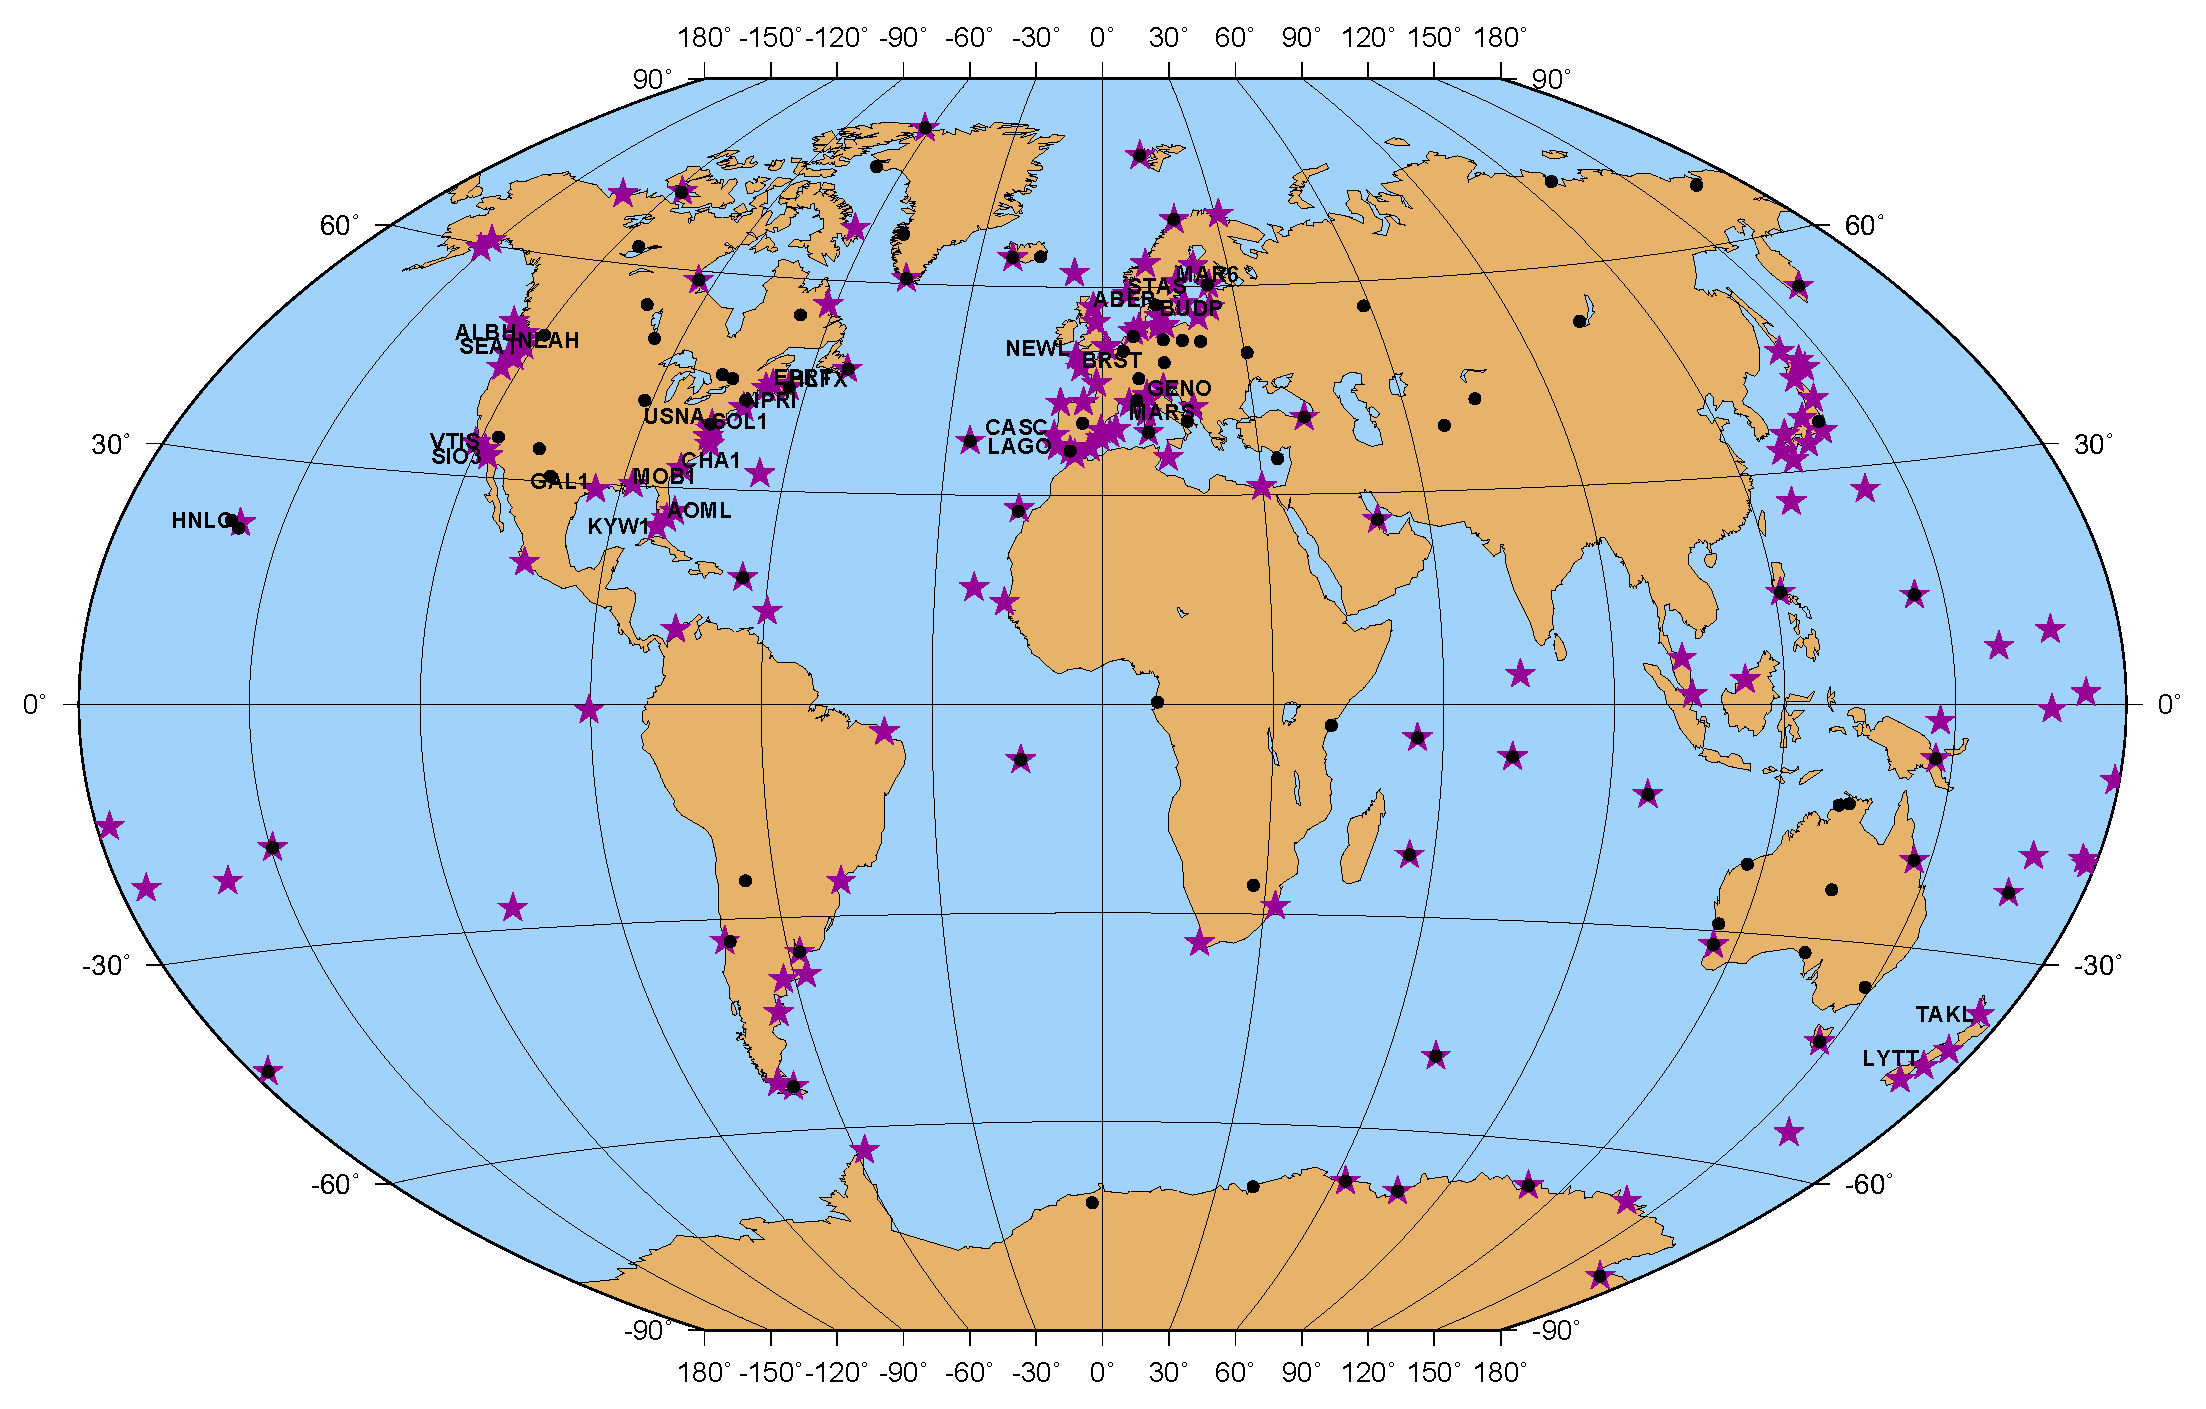
Double-differenced ionosphere-free GPS carrier phase observations from a global network of 420 stations were reanalyzed using GAMIT/GLOBK software version 10.4. The data set covered the period January 1995 to December 2010 and 282 stations out of 420 were co-located with a tide gauge. Station coordinates, satellite orbits, Earth orientation parameters (EOPs), and zenith tropospheric delay parameters every hour, were estimated. Details on the GPS data processing strategy (models, corrections,...) can be found in the IGS-like ULR analysis centre form associated with this solution.
The GPS velocities were obtained in the final step of the analysis which combined the weekly GAMIT/GLOBK global network solutions (station coordinates with full co-variances) from the entire data time span into a long-term solution using CATREF software. This long-term solution (ULR5) was aligned to ITRF2008 using minimal constraints over a selected set of IGS Reference Frame stations.
-
- Solution data files
Please cite this paper if you find the results useful :
Santamaría-Gómez A., Gravelle M., Collilieux X., Guichard M., Martín Míguez B., Tiphaneau P., Wöppelmann G., (2012). Mitigating the effects of vertical land motion in long tide gauge records using a state-of-the-art GPS velocity field, Global and Planetary Change, Vol. 98-99, pp. 6-17.
To assign more realistic uncertainties on the GPS velocities, the noise content in the position time series was examined by the maximum likelihood estimation (MLE) technique using CATS software. Time series were detrended and deseasoned (annual cycles) at the CATREF stage. Details on the GPS velocity uncertainty assessment will be given in the above-mentioned paper.
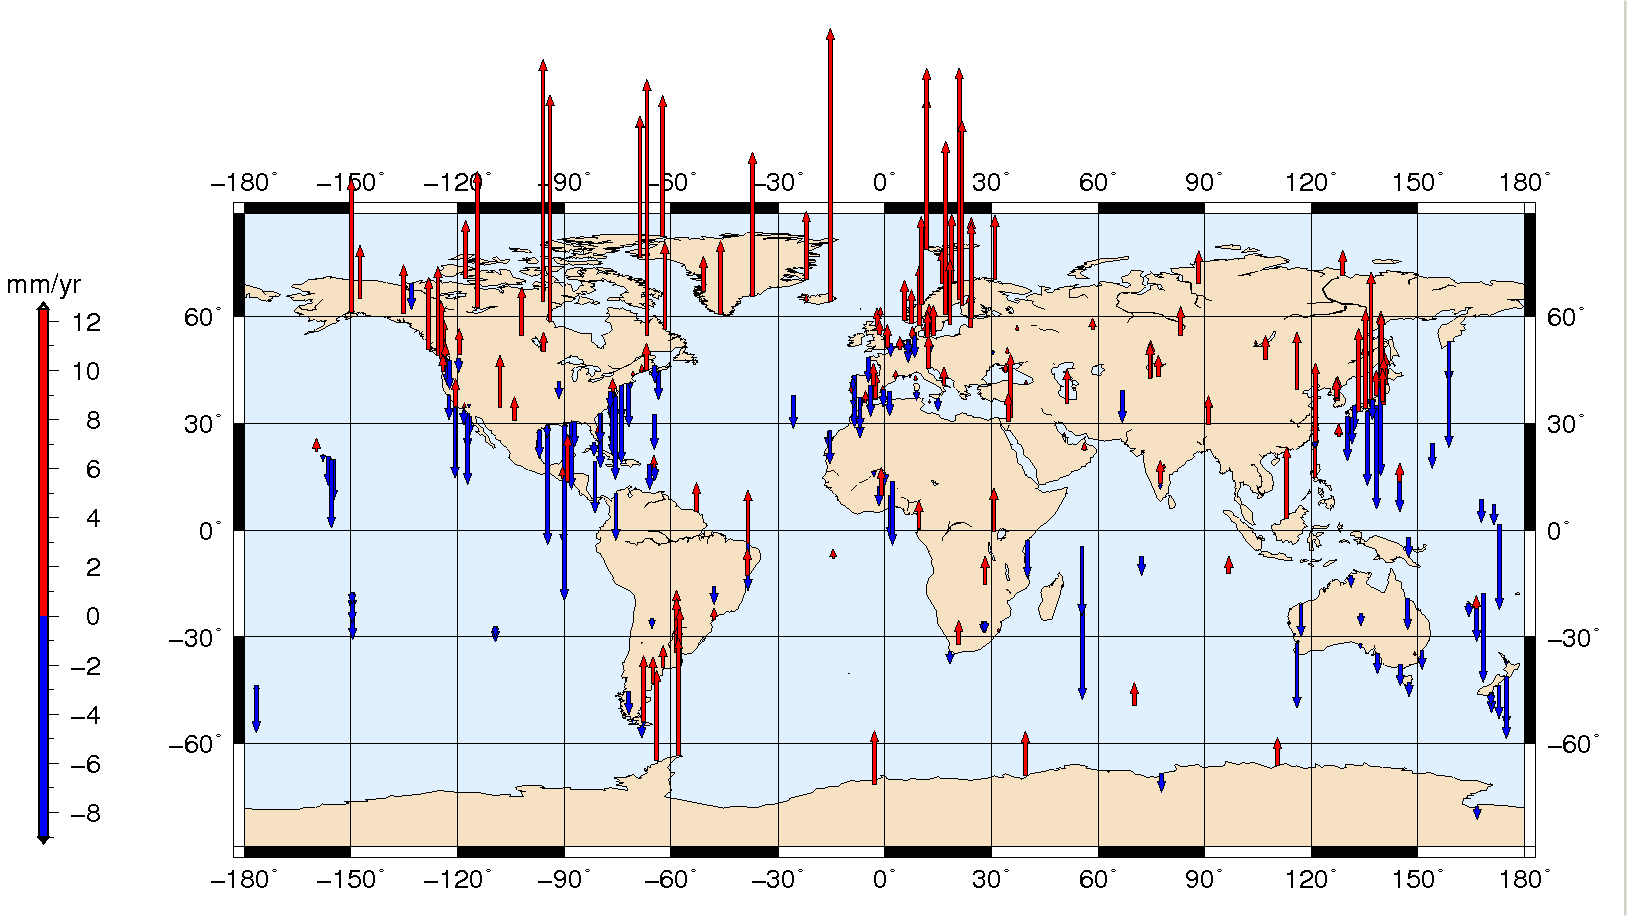
– The ULR5_Vertical-Velocities_Table provides the vertical GPS velocities and uncertainties for the 326 stations fulfilling the criterias of 3 years of minimum length without discontinuities and with data gaps not exceeding 30%.
– The ULR5_detrend.zip file contains individual station data files of weekly residual position time series in ITRF2008 with respect to the linear long-term combined solution at the reference epoch. These residuals (detrended and deseasoned) are expressed in meters in the local frame (North, East, and Up). The reference position and the 3D velocity in the local coordinate system (East, North, Up) are provided in the header of each file.
– The ULR5_discontinuities_Table.txt file provides the offsets that were estimated.
– The ulr5.kmz file shows a Google Earth presentation of the above weekly data files by cliking on a station symbol. The associated IGS-like sitelog can be accessed too, as well as a plot of the residual position time series in the vertical.
– The long-term solution ULR5 in SINEX format (250 Mo) can be downloaded too. However, we recommend its use only to those familiar with SINEX files, and having a good geodetic background and experience.
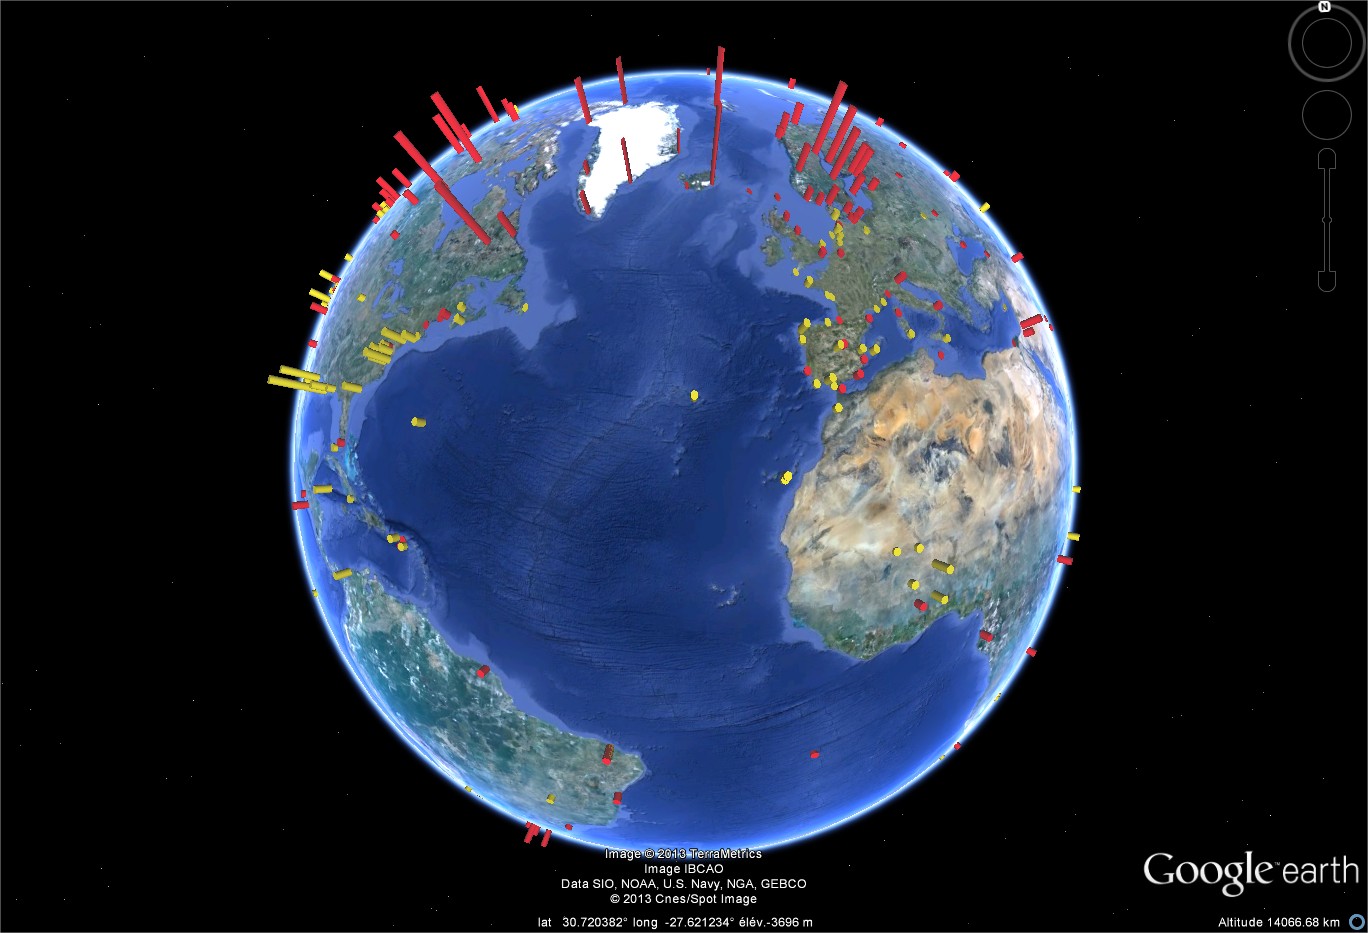
– The ULR5_Vertcal_Velocites.kmz file shows a Google Earth presentation of the ULR5 vertical velocities. For each GPS station a vertical cylinder whose height is proportionnal to the estimated velocity is drawn (yellow for subsidence, red for uplift).
ULR4 solution (2011)
Several GPS solutions have been produced so far by the ULR analysis centre consortium as new analyses strategies were devised (models, parameterization,...). The latest solution, called ULR4, contributed to the IGS first reprocessing campaign. Its vertical velocity field is published in Journal of Geophysical Research. It is expressed in ITRF2005 using 13 years of GPS data.
-
- Main features
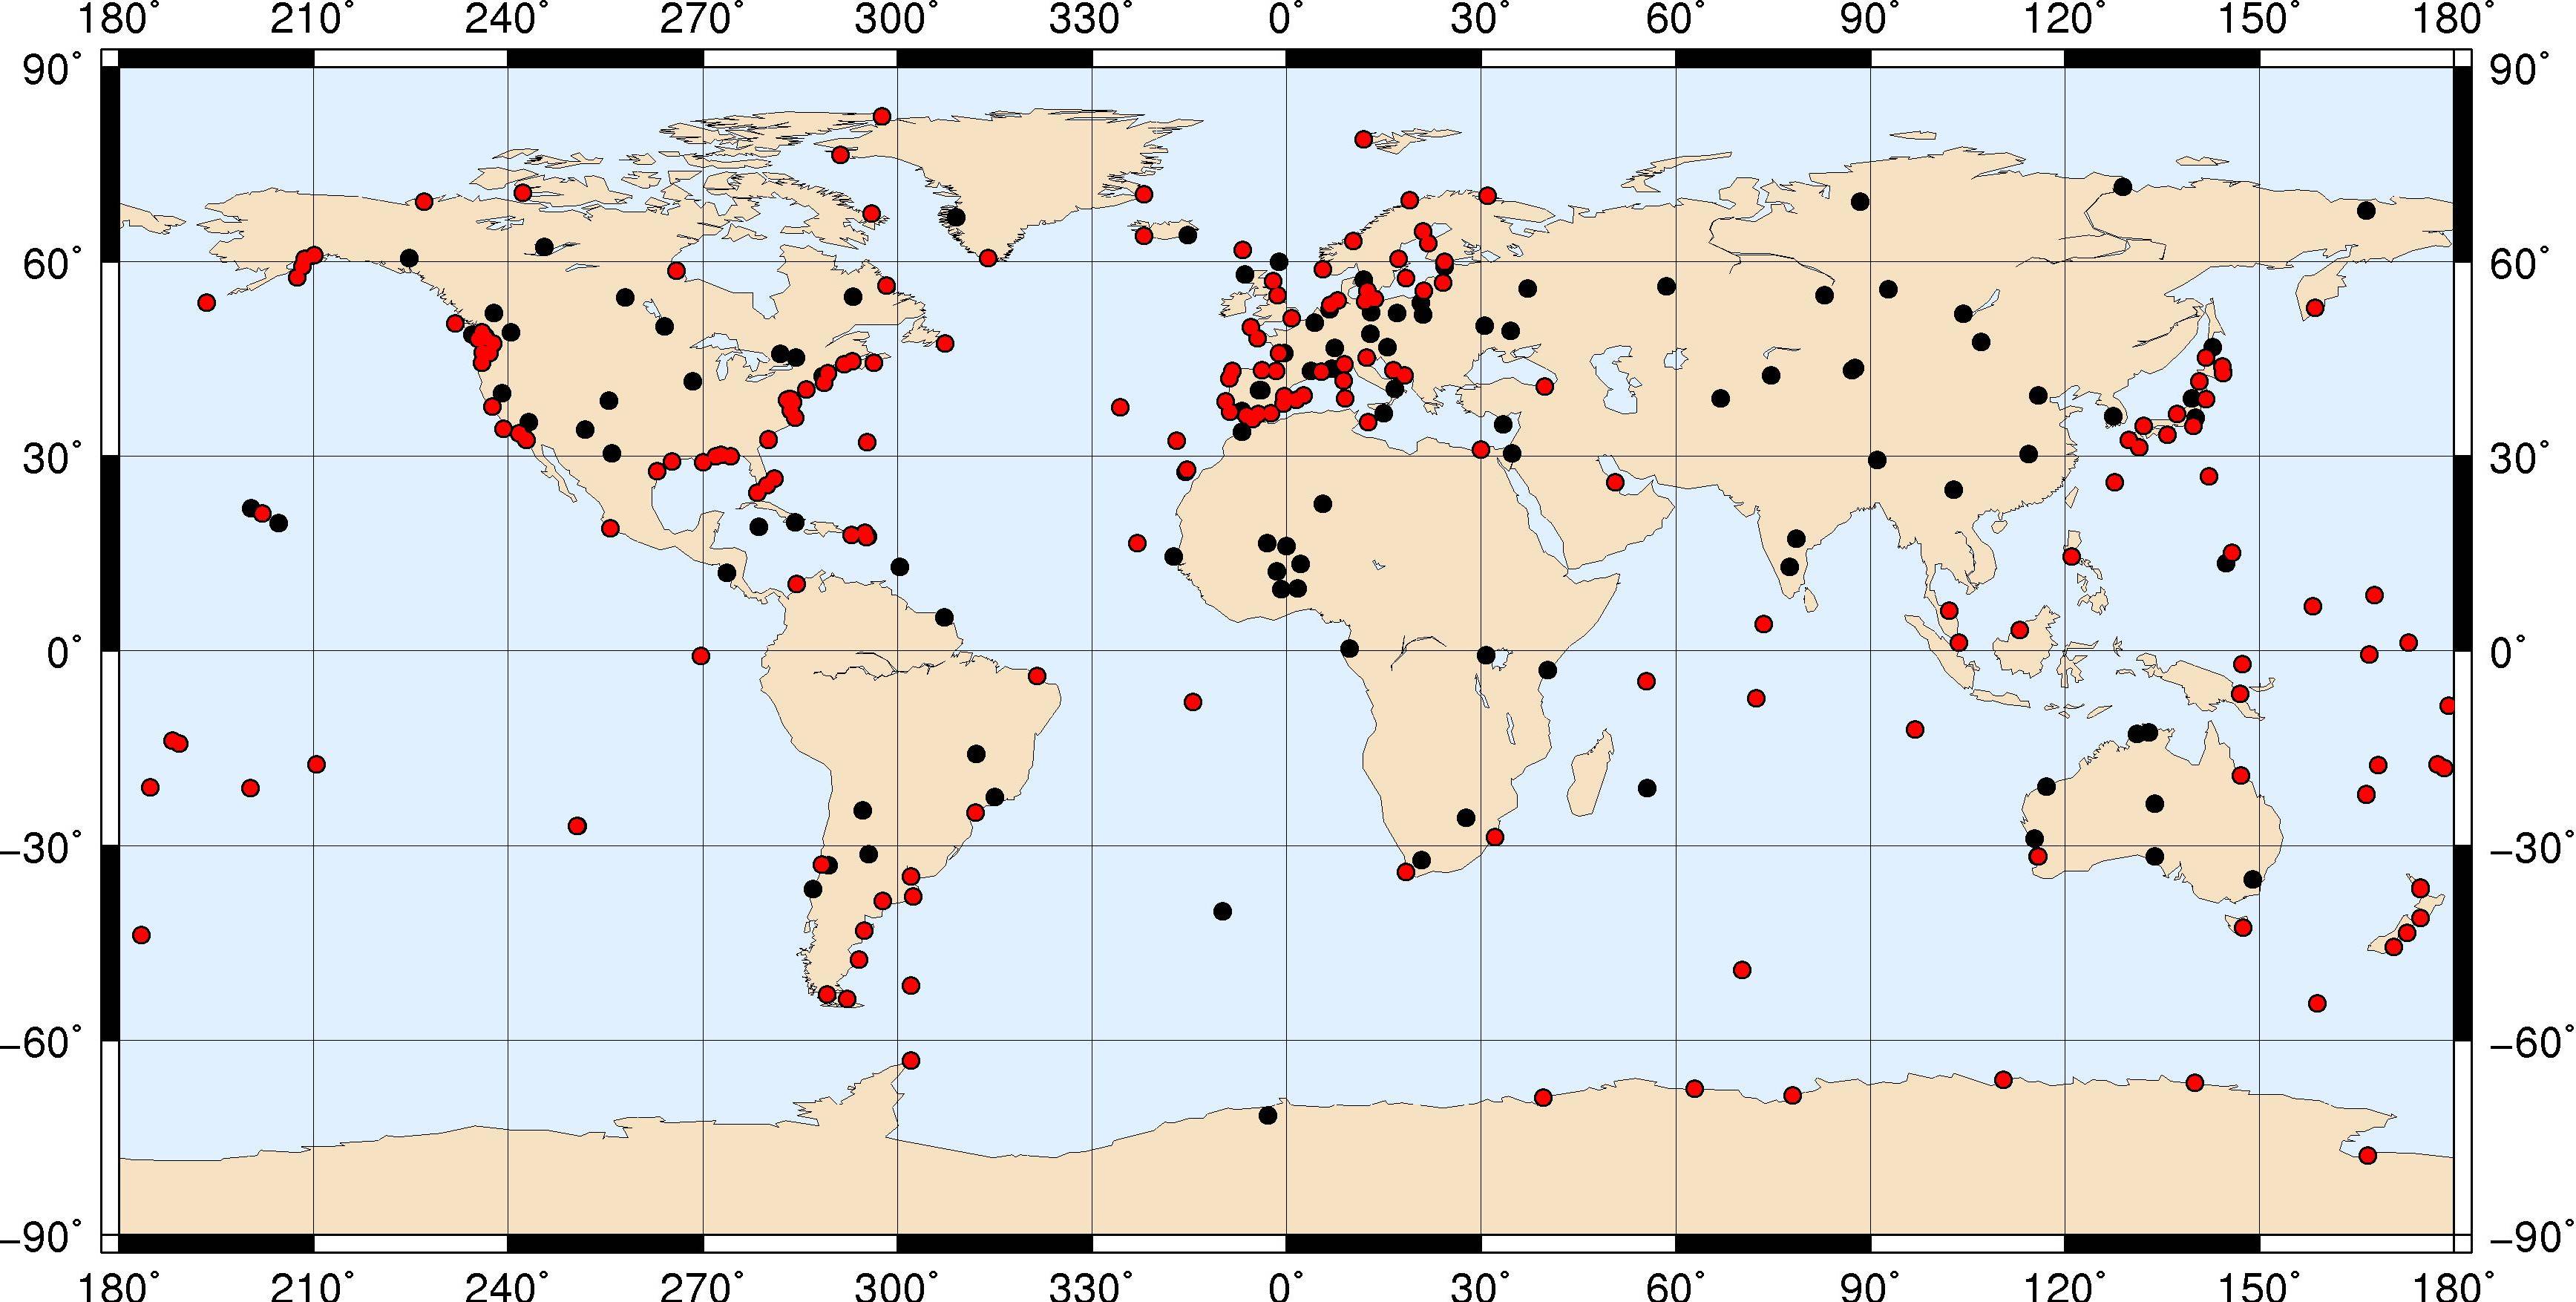
Double-differenced ionosphere-free GPS carrier phase observations from a global network of 316 stations were reanalyzed using GAMIT/GLOBK software version 10.34. The dataset covered the period January 1996 to December 2008 and 216 stations out of 316 were co-located with a tide gauge. Station coordinates, satellite orbits, Earth orientation parameters (EOPs), and zenith tropospheric delay parameters every 2 hours, were estimated. Details on the GPS data processing strategy (models, corrections,...) can be found in the IGS-like ULR analysis centre form associated with this solution.
The GPS velocities were obtained in the final step of the analysis which combined the weekly GAMIT/GLOBK global network solutions (station coordinates with full co-variances) from the entire data time span into a long-term solution using CATREF software. This long-term solution (ULR4) was aligned to ITRF2005 using minimal constraints over a selected set of IGS Reference Frame stations. A detailed description can be found in
Santamaria-Gomez A., M-N. Bouin, Wöppelmann (2012) : Improved GPS data analysis strategy for tide gauge benchmark monitoring. International Association of Geodesy Symposia 136, Geodesy for Planet Earth, pp. 11-18, doi:10.1007/978-3-642-20338-1_2.
-
- Solution data files
The ULR4 vertical velocity field itself is published in
Santamaria-Gomez A., M-N. Bouin, X. Collilieux, Wöppelmann (2011) : Correlated Errors in GPS Position Time Series : Implications for Velocity Estimates. Journal of Geophysical Research, 116, B01405, doi:10.1029/2010JB007701.
Please cite this paper if you find the results useful.
To assign more realistic uncertainties on the GPS velocities, the noise content in the position time series was examined by the maximum likelihood estimation (MLE) technique using CATS software. Many stochastic models were investigated. Time series were detrended and deseasoned (annual and semi-annual cycles) at the CATREF stage. Details on the GPS velocity uncertainty assessment can be found in the above-mentioned paper.
– The ulr4_Vertical-Velocities_Table.txt provides the vertical GPS velocities and uncertainties for the 275 stations fulfilling the criteria of 2.5 years of minimum length without discontinuities and more than 70% of valid data in the time series.
– The ulr4_detrend.zip file contains individual station data files of weekly residual position time series in ITRF2005 with respect to the linear long-term combined solution at the central reference epoch. These residuals (detrended and deseasoned) are expressed in metres in the local frame (North, East, and Up). The long-term position and velocity are provided in the header of each file. The ULR4_discontinuities_Table.txt file provides the offsets that were estimated.
– The ulr4.kmz file shows a Google Earth presentation of the above weekly data files by cliking on a station symbol. The associated IGS-like sitelog can be accessed too, as well as a view of the position time series in the vertical.
– The long-term solution ULR4 in SINEX format (47 Mo) can be downloaded too. However, we recommend its use only to those familiar with SINEX files, and having a good geodetic background and experience.
ULR3 solution (2009)
ULR3 solution was expressed in ITRF2005 using GPS data from January 1997 to November 2006, whereas the previous solution (published in Global and Planetary Change) was expressed in ITRF2000 over a shorter data span. ULR3 was included in the IGS contribution to ITRF2008 realisation.
[*Main features *]
Double-differenced ionosphere-free GPS carrier phase observations from a global network of 227 stations were analyzed using GAMIT software version 10.21 (160 were co-located with a tide gauge). Station coordinates, satellite orbits, Earth orientation parameters (EOPs), and zenith tropospheric delay parameters every 2 hours, were estimated. An important feature to outline is the use of absolute antenna phase centre corrections for satellites and receivers. The GAMIT solutions were loosely constrained global solutions. The final step combined weekly solutions over the entire data time span (station coordinates with full co-variances) into a long-term solution using CATREF sofware. This long-term solution (called ULR3) was aligned into the ITRF2005 using minimal constraints over all the transformation parameters with a selected set of IGS RF stations. A detailed description can be found in
Wöppelmann G., C. Letetrel, A. Santamaria, M-N. Bouin, X. Collilieux, Z. Altamimi, S.D.P. Williams, B. Martin Miguez (2009) : Rates of sea-level change over the past century in a geocentric reference frame. Geophys. Res. Lett., 36, L12607, doi:10.1029/2008GL038720.
Please cite this article if you find the results useful. More details on the GPS data processing strategy can also be found in the IGS-like ULR analysis centre form associated with this solution.
[*Solution data files *]
– The ulr3_detrend.zip file contains individual station data files of weekly position time series residuals in ITRF2005 with respect to the linear long-term combined solution (given in the header in cartesian and geographic coordinates) at the central reference epoch. The format is straightforward. Residuals are expressed in metres in the local frame (North, East, and Up). The velocities are also provided in the header.
– The cgpstg_ulr3.kmz file shows a Google Earth presentation of the above weekly data files by cliking on a station symbol. The associated IGS-like sitelog can be accessed too, as well as a view of the position time series in the vertical.
– The cgpstg_ulr3table.txt provides the vertical GPS velocities and noise characteristics for the 180 stations fulfilling the criteria of 3.5 years of minimum length with more than 70% of valid data in the time series. Indeed, the errors given in the previous files are formal errors. To assign more realistic uncertainties on the GPS velocities, the noise content in the position time series was examined by the maximum likelihood estimation (MLE) technique using CATS software.


