Santa Cruz de Tenerife
Contributing agency

Station summaryGRAF


| IGS-type acronym : | GRAF |
| Latitude : | 28.45388628 |
| Longitude : | -16.26787579 |
| Installed date : | 2010-04-06 |
| Decommissioned date : | |
| Country : | SPAIN |
| City: | TENERIFE |
| Station status : | active (green) |
| Distance to Tide Gauge (m) : | 3683 |
| Domes Nr.: | 31327M001 |
| Station operator: | Unknown |
| IGS-like station form : |
GPS position times seriesGRAF
Position
(Reference epoch: )
(Reference epoch: )
Offsets (mm)
| M | Material change or malfunction |
| E | Earthquake |
| RF | Reference Frame change |
| U | Unknown |
| NA | Not available |
| Position discontinuity | |
| Velocity discontinuity |
Data available at SONELGRAF
Quality plots on RINEX filesGRAF
 |
 |
Plots generated using software developed with the EPN team at ROB |
| Observations & tracking performance | Satellite tracking |
 (this operation may take 20 to 45s)
The satellite tracking graph has been calculated for all stations for the first day of each month. If you wish to have a graph for another date, choose the 'Calculate a specific date' option.
Co-located instrumentsGRAF
- GPS : Santa Cruz de Tenerife (TN01)
- Tide gauge : SANTA CRUZ DE TENERIFE I (TNTG1)
- Tide gauge : TENERIFE (TENER)
- GPS : La Laguna (LLAG)
Leveling & DatumsGRAF
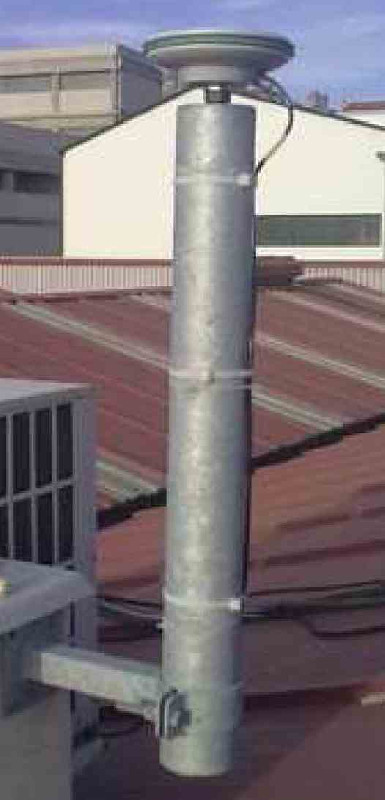
Photo albumGRAF