VARDOE

Contributing agency

Station summaryVAR1

GNSS-IR
  • More informations on each symbol.
  • GPS
    Tide Gauge
    DORIS
IGS-type acronym : VAR1
Latitude : 70.37497778
Longitude : 31.10401389
Installed date : 2005-02-28
Decommissioned date :
Country : NORWAY
City: VARDOE
Station status : active (green)
Distance to Tide Gauge (m) : 1
Domes Nr.: 10364M001
Station operator: Asmund Steen Skjaeveland
(NMA) - Norwegian Mapping Authority - Kartverket
IGS-like station form :

GPS position times seriesVAR1

SARI


Position
(Reference epoch: )


Offsets (mm)

MMaterial change or malfunction
EEarthquake
RFReference Frame change
UUnknown
NANot available
Position discontinuity
Velocity discontinuity
     
   
Vertical component
   
East component
   
North Component


Data available at SONELVAR1


                DATA POLICY FOR STATIONS PROVIDED BY NMA
                (Norwegian Mapping Authority)


The Norwegian Mapping Authority provides RINEX data from these stations 
to SONEL: 

- AND1 (Andenes tide gauge)
- FROC (Froeya/Mausundvaer GNSS)
- HONS (Honningsvaag GNSS)
- TGDE (Tregde tide gauge)
- VAR1 (Vardoe tide gauge)
- VIKC (Vikna GNSS/Roervik)


CONDITIONS OF USE AND REUSE:

Data are delivered in daily files, 30-second data rates with a 25 day 
delay. The data are intended for non-commercial research or education 
use only. Commercial use is not allowed. 

Please inform Norwegian Mapping Authority by email 
 if these data are used in published research. 

The data are provided as-is, free of charge for the intended uses. The 
Norwegian Mapping Authority gives no guarantee of and assumes no 
responsibility for the accuracy, completeness or usefulness of any data. 
In particular, VAR1 is known to have an annual north-south oscillation. 

SONEL also collects data from NMA GNSS stations published via EUREF and 
IGS. Different conditions apply to these stations. 

Contact NMA Control Centre for positioning services at 
 for questions or further info. 

Quality plots on RINEX filesVAR1

Quality plots on RINEX files of VAR1 Quality plots on RINEX files of VAR1 Royal Observatory of Belgium

Plots generated using software developed with the EPN team at ROB
Observations & tracking performance Satellite tracking

informations (this operation may take 20 to 45s)

The satellite tracking graph has been calculated for all stations for the first day of each month. If you wish to have a graph for another date, choose the 'Calculate a specific date' option.
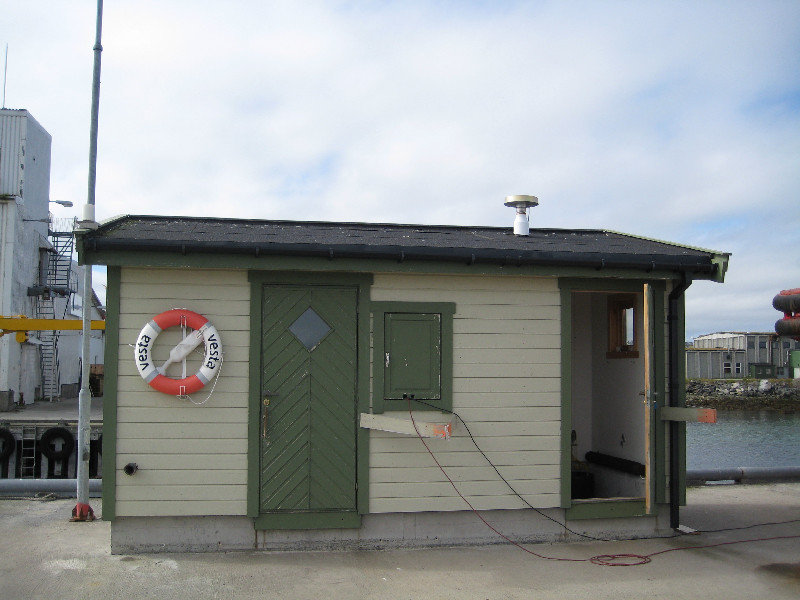
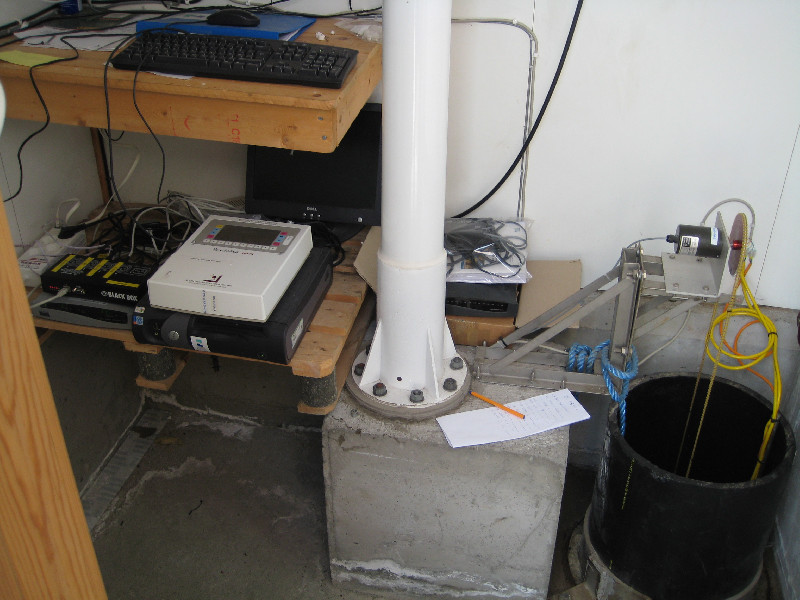
Co-located instrumentsVAR1

Photo albumVAR1