LEVELING OF TUVALU
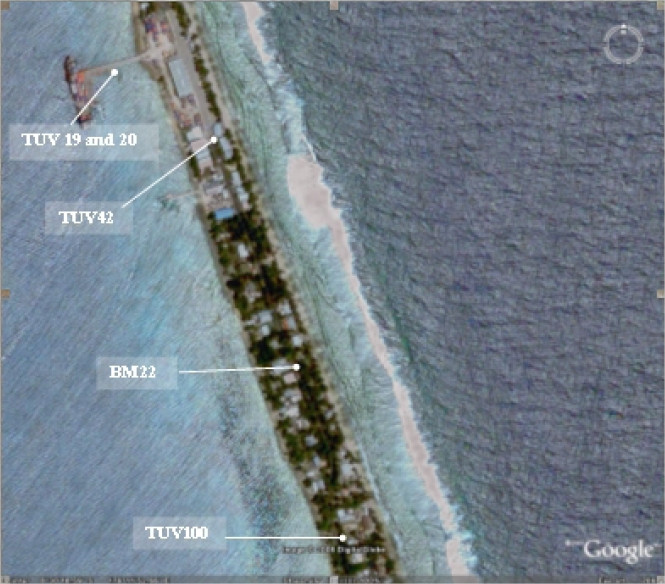
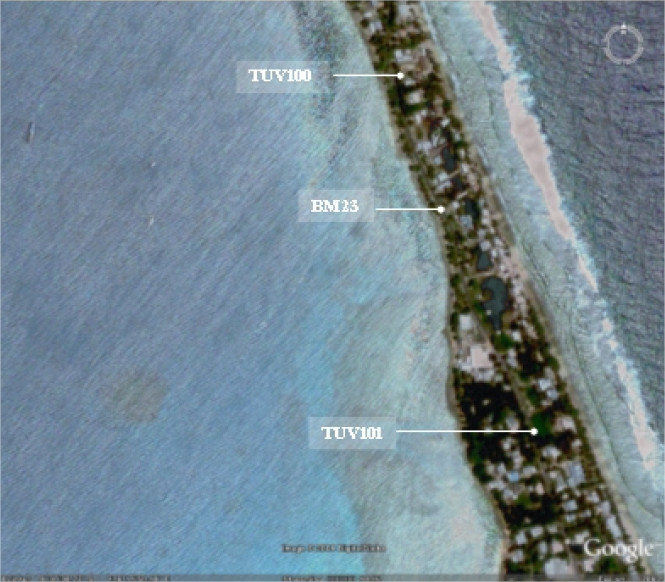
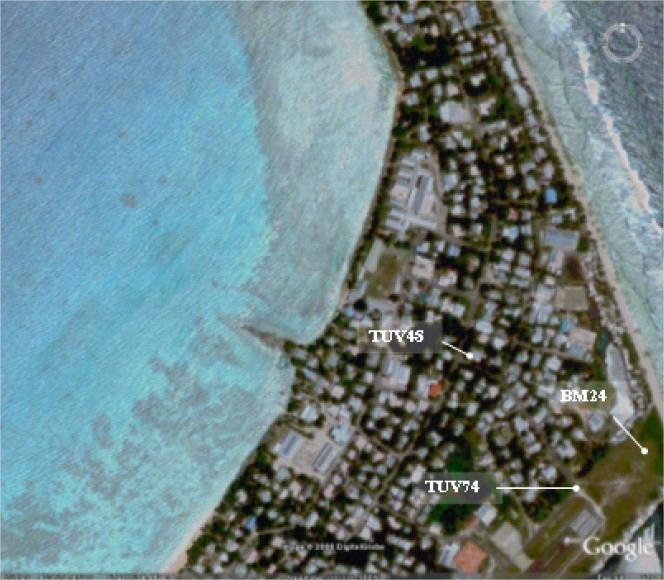
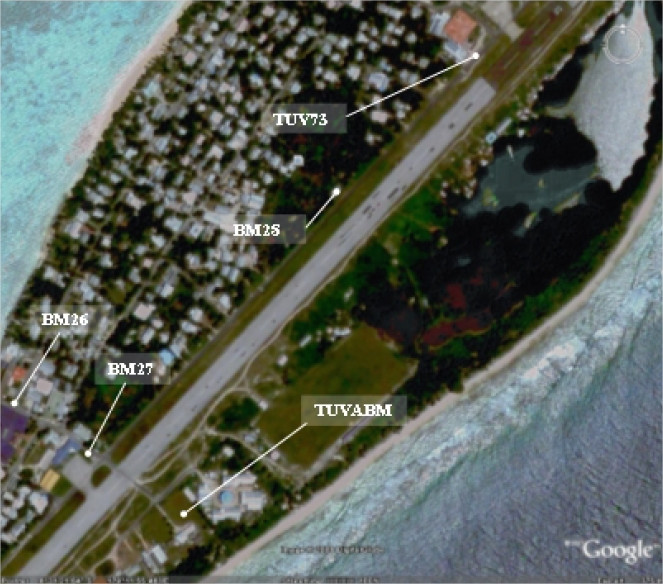
Benchmark positionning related to the tide gauge station


Benchmarks description table
Benchmarks vertical positionning diagram
Reference:
Leveling evolution
| Stand point | BM22 | BM22 | BM22 | BM22 | BM22 | BM22 | BM22 | BM22 | BM22 | TUVABM | ||
|---|---|---|---|---|---|---|---|---|---|---|---|---|
| End point | BM23 | BM24 | BM26 | BM27 | BM28 | TUV19 | TUV20 | TUVABM | BM25 | TUVA | ||
| Distance (m) | ---- | ---- | ---- | ---- | ---- | ---- | ---- | ---- | ---- | ---- | ||
| Height difference (m) | Campaign 12 | 2009-06-15 | -0.0857 ± 0.001 | 0.5712 ± 0.001 | -0.1172 ± 0.001 | -1.0092 ± 0.001 | -1.0083 ± 0.001 | 0.2623 ± 0.001 | 1.2334 ± 0.001 | -0.4836 ± 0.001 | --- | 0.9631 ± 0.001 |
| Campaign 11 | 2007-06-15 | -0.0861 ± 0.001 | 0.5708 ± 0.001 | -0.1175 ± 0.001 | -1.0097 ± 0.001 | --- | 0.2625 ± 0.001 | 1.2339 ± 0.001 | -0.4847 ± 0.001 | --- | 0.9631 ± 0.001 | |
| Campaign 10 | 2005-09-15 | -0.0861 ± 0.001 | 0.5710 ± 0.001 | -0.1155 ± 0.001 | -1.0077 ± 0.001 | --- | 0.2613 ± 0.001 | 1.2339 ± 0.001 | -0.4822 ± 0.001 | 0.3119 ± 0.001 | 0.9631 ± 0.001 | |
| Campaign 9 | 2005-06-15 | -0.0868 ± 0.001 | 0.5705 ± 0.001 | -0.1152 ± 0.001 | -1.0078 ± 0.001 | --- | 0.2610 ± 0.001 | 1.2338 ± 0.001 | -0.4829 ± 0.001 | 0.3125 ± 0.001 | 0.9631 ± 0.001 | |
| Campaign 8 | 2003-06-15 | -0.0863 ± 0.001 | 0.5706 ± 0.001 | -0.1155 ± 0.001 | -1.0089 ± 0.001 | --- | 0.2597 ± 0.001 | 1.2339 ± 0.001 | -0.4840 ± 0.001 | 0.3115 ± 0.001 | 0.9631 ± 0.001 | |
| Campaign 7 | 2002-06-15 | -0.0864 ± 0.001 | 0.5698 ± 0.001 | --- | --- | --- | 0.2594 ± 0.001 | 1.2345 ± 0.001 | --- | --- | --- | |
| Campaign 6 | 2000-06-15 | -0.0868 ± 0.001 | 0.5697 ± 0.001 | --- | --- | --- | 0.2588 ± 0.001 | 1.2346 ± 0.001 | --- | --- | --- | |
| Campaign 5 | 1998-06-15 | -0.0871 ± 0.001 | 0.5699 ± 0.001 | --- | --- | --- | 0.2594 ± 0.001 | 1.2361 ± 0.001 | --- | --- | --- | |
| Campaign 4 | 1997-06-15 | -0.0867 ± 0.001 | 0.5704 ± 0.001 | --- | --- | --- | 0.2580 ± 0.001 | 1.2354 ± 0.001 | --- | --- | --- | |
| Campaign 3 | 1995-06-15 | -0.0862 ± 0.001 | 0.5718 ± 0.001 | --- | --- | --- | 0.2579 ± 0.001 | 1.2355 ± 0.001 | --- | --- | --- | |
| Campaign 2 | 1994-06-15 | -0.0860 ± 0.001 | 0.5714 ± 0.001 | --- | --- | --- | 0.2572 ± 0.001 | 1.2349 ± 0.001 | --- | --- | --- | |
| Campaign 1 | 1993-06-15 | -0.0869 ± 0.001 | 0.5728 ± 0.001 | --- | --- | --- | 0.2559 ± 0.001 | 1.2345 ± 0.001 | --- | --- | --- | |
| Height difference evolution graph |  |  |  |  |  |  |  |  |  |  | ||
Download leveling data
TIDE GAUGE LOCAL LEVELING NETWORK DATA OF STATION TUVALU
-----------------------------------------------------------------------------------------------------
Benchmark Lat. Long. Height Year of determination St.dev Distance_to_TG
10chr (°) 14chr (°) 14chr (m) 10chr 22chr (m)10chr (m) 10chr
-----------------------------------------------------------------------------------------------------
BM22 ---- ---- 9.000 2009 0.00000 ----
BM23 ---- ---- 8.914 2009 0.00100 ----
BM24 ---- ---- 9.571 2009 0.00100 ----
BM25 ---- ---- 9.312 2005 0.00100 ----
BM26 ---- ---- 8.883 2009 0.00100 ----
BM27 ---- ---- 7.991 2009 0.00100 ----
BM28 ---- ---- 7.992 2009 0.00100 ----
TUV19 ---- ---- 9.262 2009 0.00100 ----
TUV20 ---- ---- 10.233 2009 0.00100 ----
TUVABM ---- ---- 8.516 2009 0.00100 ----
TUVA ---- ---- 9.480 2009 0.00200 ----
Co-located instruments
- GPS : TUVALU (TUVA)
- Tide Gauge : FUNAFUTI B (TUVTG)
Photo album