GAO

Station summaryGAO1

  • More informations on each symbol.
  • GPS
    Tide Gauge
    DORIS
IGS-type acronym : GAO1
Latitude : 16.25212000
Longitude : 359.99399000
Installed date : 2005-08-29
Decommissioned date :
Country : MALI
City: GAO
Station status : No data for 30 days (orange)
Domes Nr.: 33503M001
Station operator: Unknown
IGS-like station form :

GPS position times seriesGAO1

SARI


Position
(Reference epoch: )


Offsets (mm)

MMaterial change or malfunction
EEarthquake
RFReference Frame change
UUnknown
NANot available
Position discontinuity
Velocity discontinuity
     
   
Vertical component
   
East component
   
North Component


Data available at SONELGAO1


                DATA POLICY FOR STATIONS PROVIDED BY AMMA
         (Analyses Multidisciplinaires de la Mousson Africaine)


GPS stations:
- DJOU (DJOUGOU, BENIN)
- GAO1 (GAO, MALI)
- NIAM (NIAMEY, NIGER)
- OUAG (OUAGADOUGOU, BURKINA FASO)
- TAMA (TAMALE, GHANA)
- TOMB (TOMBOUCTOU, MALI)

have been installed in the framework of AMMA (http://www.amma-international.org/).

Any publication using data from the AMMA GPS stations should acknowledge the work
of the scientists having achieved the collection of the data. Therefore, the
following article should be quoted:

Bock O., M.N. Bouin, E. Doerflinger, P. Collard, F. Masson, R. Meynadier,
S. Nahmani, M. Koité, K. Gaptia Lawan Balawan, F. Didé, D. Ouedraogo,
S. Pokperlaar, J.-B. Ngamini,  J.P. Lafore , S. Janicot, F. Guichard,
and M. Nuret (2008). The West African Monsoon observed with ground-based GPS
receivers during AMMA.  J. Geophys. Res., 113, D21105, doi:10.1029/2008JD010327.

Further information can be found at http://amma-gps.ign.fr 

Contact: Olivier.Bock@ign.fr 

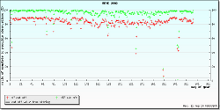
Quality plots on RINEX filesGAO1

Quality plots on RINEX files of GAO1 Quality plots on RINEX files of GAO1 Royal Observatory of Belgium

Plots generated using software developed with the EPN team at ROB
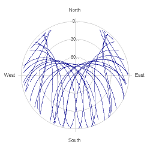
Observations & tracking performance Satellite tracking

informations (this operation may take 20 to 45s)

The satellite tracking graph has been calculated for all stations for the first day of each month. If you wish to have a graph for another date, choose the 'Calculate a specific date' option.