


Daily, monthly and annual mean sea levels
The data and graphs concerning daily, monthly and annual mean sea levels have been available on SONEL since October 2010 for the French stations (a link to the PSMSL is provided for international stations when the page specific to the station is identified and the tide gauge is co-located with GPS or DORIS). The means are calculated from the Demerliac filter and the Doodson filter (see details in the article "Calculating the mean sea levels"), with the possibility of a choice for the user.
The graphs
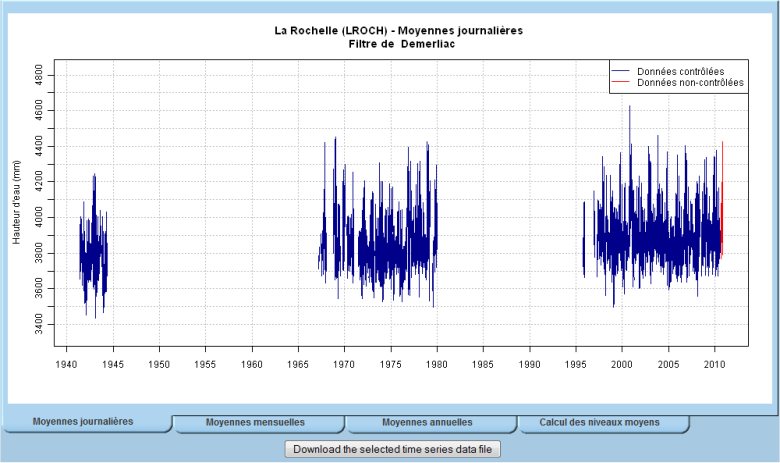
The graphs in the individual pages per station show the means calculated from quality controlled (QC’ed) observations (in blue) and non-QC’ed observations (in red). An example is given on the image below, which is taken from the page of the La Rochelle station.
– The non-QC’ed observations are files of raw measurements sampled every 10 minutes. A 10-min raw mesurement usually corresponds to a sea level value averaged over an integration period of two minutes (short-term oscillations such as waves are filtered out) from 1-second samples. They are not in any way verified by SHOM, and should therefore be used with the greatest of precaution, even though a high-tech modern instrument is used (See the results of experiments conducted with radar gauges published in Journal of Coastal Research). The 10-min data files are available roughly one week after the actual date on which the measurement was made.
– The QC’ed observations, which are hourly data files, have been verified by the SHOM, after being subjected to different quality controls. The values come from the 10-min. observation files which are resampled on the hour. The QC’ed data are available roughly 2-3 months after the actual date on which the measurements were made. (For details on the quality controls carried out by SHOM).
The files of average values and their format
Only the daily, monthly and annual averages calculated from QC’ed data are available. They are presented in the form of a two-column matrix : the date (in decimal years) and sea level (in millimetres). The format adopted is that of the PSMSL, as are the calculation criteria for the monthly and annual means, in particular for the issue of observation gaps.
They can be downloaded individually from the Web page of the tide gauge by clicking on the button situated under the graph of the means chosen. However, they are also available on the FTP server (ftp.sonel.org) which is very practical when a rapid acces to the data from several stations is required. This is how the names of the data files are defined :
– The first letter in lower case :
"d" for the daily means, "m" for the monthly means and "y" for the yearly means
– The acronym of the station, in capital letters, is made up of 5 letters (the internal identifier of the SONEL data base)
– The extension ".slv", for the type of quantity "sea level".
Example: the daily means file of La Rochelle is called dLROCH.slv
Structure of the file system in the FTP server
|-- legos
|   |-- rosame
|   <span class="base64" title="PGNvZGUgY2xhc3M9J3NwaXBfY29kZSBzcGlwX2NvZGVfaW5saW5lJyBkaXI9J2x0cic+LS0gc2FvX3RvbWUNCnwtLSBzaG9tDQp8ICZuYnNwOyB8LS0gSEFVVF8xMCAmbmJzcDsgJm5ic3A7ICZuYnNwOyAmbmJzcDsgJm5ic3A7ID0mZ3Q7IEZpbGVzIG9mIG9ic2VydmF0aW9ucyBhdCAxMCBtaW51dGVzDQp8ICZuYnNwOyB8ICZuYnNwOyB8LS0gUkVDRU5UICZuYnNwOyAmbmJzcDsgJm5ic3A7ICZuYnNwOyAmbmJzcDsgLSZndDsgd2l0aCB0aGUgNTAwMDAgbGF0ZXN0IG9ic2VydmF0aW9ucyBhdCAxMCBtaW4uDQp8ICZuYnNwOyB8PC9jb2RlPg=="></span>-- TOTAL            -> complete
|   <span class="base64" title="PGNvZGUgY2xhc3M9J3NwaXBfY29kZSBzcGlwX2NvZGVfaW5saW5lJyBkaXI9J2x0cic+LS0gSEFVVF9IT1IgJm5ic3A7ICZuYnNwOyAmbmJzcDsgJm5ic3A7ICZuYnNwOz0mZ3Q7IEZpbGVzIG9mIFFDJ2VkIGhvdXJseSBvYnNlcnZhdGlvbnMNCnwgJm5ic3A7ICZuYnNwOyAmbmJzcDsgfC0tIFRPVEFMICZuYnNwOyAmbmJzcDsgJm5ic3A7ICZuYnNwOyAmbmJzcDsgJm5ic3A7LSZndDsgY29tcGxldGUNCnw8L2NvZGU+"></span>-- VALID            -> with the observations of the current year
<span class="base64" title="PGNvZGUgY2xhc3M9J3NwaXBfY29kZSBzcGlwX2NvZGVfaW5saW5lJyBkaXI9J2x0cic+LS0gTVNMDQogJm5ic3A7ICZuYnNwO3wtLSBEZW1lcmxpYWMgJm5ic3A7ICZuYnNwOyAmbmJzcDsgJm5ic3A7ICZuYnNwOz0mZ3Q7IE5hbWUgb2YgdGhlIGZpbHRlciB1c2VkDQogJm5ic3A7ICZuYnNwO3wgJm5ic3A7IHwtLSBkYXRhICZuYnNwOyAmbmJzcDsgJm5ic3A7ICZuYnNwOyAmbmJzcDsgJm5ic3A7ICZuYnNwOy0mZ3Q7IEZpbGVzIG9mIG1lYW4gdmFsdWVzDQogJm5ic3A7ICZuYnNwO3w8L2NvZGU+"></span>-- graphs            -> Graphs displayed on the Web site
    <span class="base64" title="PGNvZGUgY2xhc3M9J3NwaXBfY29kZSBzcGlwX2NvZGVfaW5saW5lJyBkaXI9J2x0cic+LS0gRG9vZHNvbiAmbmJzcDsgJm5ic3A7ICZuYnNwOyAmbmJzcDsgJm5ic3A7ICZuYnNwOz0mZ3Q7IE5hbWUgb2YgdGhlIGZpbHRlciB1c2VkDQogJm5ic3A7ICZuYnNwOyAmbmJzcDsgJm5ic3A7fC0tIGRhdGEgJm5ic3A7ICZuYnNwOyAmbmJzcDsgJm5ic3A7ICZuYnNwOyAmbmJzcDsgJm5ic3A7LSZndDsgRmlsZXMgb2YgbWVhbiB2YWx1ZXM8L2NvZGU+"></span>-- graphs            -> Graphs displayed on the Web site
Reminder of the directories and their content
– legos : contains the tide gauge observations of the ROSAME network and that of Sao Tomé run by LEGOS.
– shom : contains the tide gauge observations of the RONIM network of SHOM. The sub-directory HAUT_10 contains the observations sampled at 10 min. whereas HAUT_HOR contains the QC’ed hourly observations.
– MSL (Mean Sea Level) : contains the daily, monthly and annual means, calculated from the QC’ed hourly observations.


