


Quality control of the measurements published by SHOM
Introduction
The tide gauge observations published on-line on the SONEL web site are sent by the organisations that acquire them (SHOM, LEGOS etc.) and are at various stages of validation. In compliance with the data policy of these organisations, the scientific users have free access to the observations and commit in particular to inform the producers of any problems or anomalies in the data they may encounter to help improve the quality of the series of observations published.
The tests on the data set up by SHOM are described briefly in this document for the benefit of SONEL users.
The current SHOM network comprises radar sensors and data acquisition units which constitute a homogeneous group at each station. A unique testing procedure has been established for all of the tide gauge sites.
1- Historical series
The historical series archived by SHOM and published on the SONEL web site currently concern only those tide gauges that belong to the RONIM network. They come from different French operators using various types of instruments, many of which were mechanical analog records (tidal charts). The series can have different levels of validation depending on the period and the scientific use made of them. They are generally produced from the digitisation of tidal charts that come from ports or the archives of SHOM. Some digitised series have given rise to more exhaustive tests, such as the Brest series.
The feedback from SONEL users to the SHOM data base managers enables a continuous improvement in the data series (contact: ronim@shom.fr).
2- RONIM network
2.1 Calibration and instrument control
The tide gauges are tested by a direct reading in situ of the sea level. These tests are performed regularly by SHOM and its local partners. They are carried out with an electrical probe at least twice a year in order to ensure that the instruments are accurate and in perfect working order. It is worth noting that tests performed both on the inside and the outside of the well can determine whether or not the tubes or stilling wells are silted up.
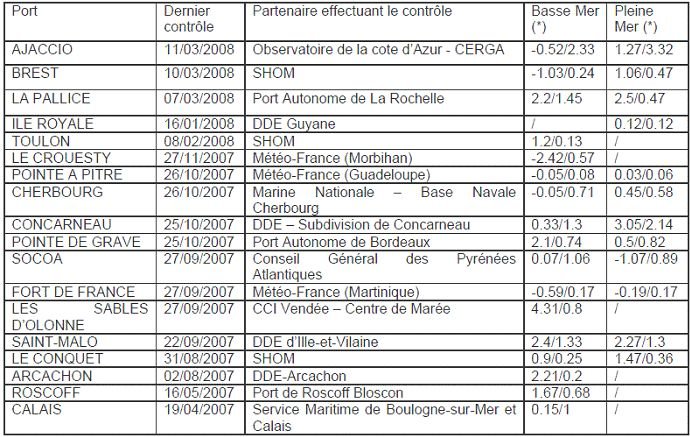
the measurement of the electrical probe and the sea level of the tide gauge in cm / Standard deviation of the differences in cm.
More in depth manual tests are occasionally carried out in situ over a complete tidal cycle (Van de Casteele test). This test involves comparing the measurements made with a tide gauge to reference sea level measurements usually made using a levelled benchmark and an electrical probe during a complete tidal cycle at spring tide. The test determines the calibration coefficients that will be applied with the instrument. SHOM systematically performs a Van de Casteele test when installing a tide gauge. Further reading on the Van de Casteele test.
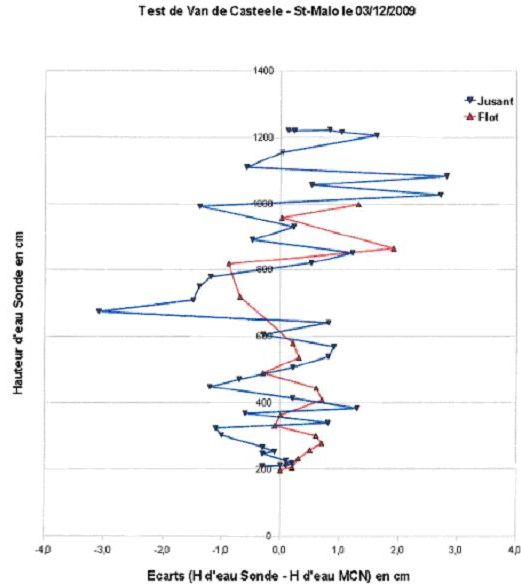
Figure 1 : Example of a Van de Casteele plot in Saint Malo.
2.2 Leveling and vertical references (datums)
The sea level observations provided are expressed in relation to the zero of nautical charts (chart datum or hydrographic zero), in accordance with the official altimetric references published by SHOM on the Internet (http://www.shom.fr/fr_page/fr_act_oceano/RAM/RAM_P1.htm).
The vertical references of each tide gauge are maintained by precise levelings of tide gauge benchmarks whose local stability is tested at least every 5 years. One of these benchmarks is defined as the fundamental benchmark of the tide observatory (or primary TGBM).
2.3 Raw data
The sea level observations are archived locally by the data acquisition units every ten minutes. Each 10-min archived value is derived from the integration (average) over 2 minutes of the individual measurements acquired each second by the radar gauge. The tide gauges are dialed-up and their data downloaded weekly by SHOM (RTC). When the data have been collected, they are made available (raw, not quality controlled) on the ftp of SONEL. The atmospheric pressure data are collected hourly by the data acquisition units and are also made available as raw data.
2.4 Quality control (QC) of data
The memory cards of the data acquisition units are cleaned every 4 months and the 10-min raw data are recovered over that entire period. At this point the data are quality controlled (QC’ed) by the SHOM manager and archived in the sea level observation data base of SHOM. The QC’ed data are then made available to SONEL on an hourly sampling basis in order to complete the historical series.
3- Procedures for QC’ing the data acquired by SHOM
3.1 Tools
The tidal calculations are carried out using the MAS software developed by SHOM, whereas archiving and visualisation are performed with the CARIS/Chersoft tide database (TDB) software (see http://www.chersoft.co.uk/products_). The latter software, whose specifications were determined by SHOM, constitutes a national sea level observation data base.
3.2 Aims
The verification of the data is intended to:
- detect unexpected anomalies in the time series or in the tidal harmonic constituents;
- filter the raw data to obtain hourly heights, and average daily, monthly and yearly levels.
3.3 Methods
3.3.1 Comparing observations versus predictions
The observations of each tide gauge are compared with the tidal predictions. The two curves are systematically visualised together with the residual from the difference between the observations and the predictions. This residual constitutes the time series of the positive/negative surges. An analysis of this residual is used to detect the main anomalies (discontinuities, peaks, etc.).
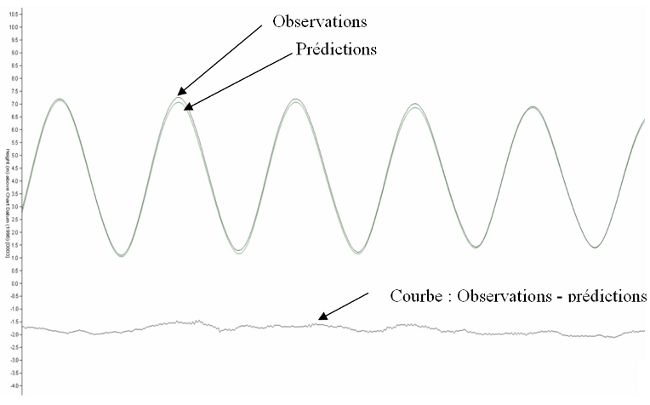
Figure 2 : Plot of the Observations, Predictions and positive/negative residuals.
The positive/negative residual is analysed with reference to the atmospheric pressure data acquired hourly by the tide gauge.
3.3.2 Standard deviations
Where required, the standard deviations of the 120 measurements sampled at 1-second are analysed. A large standard deviation associated with a suspect averaged measurement may be the result of an anomaly in the instantaneous data acquisition by the tide gauge.
3.3.3 Hourly heights
Once the data at ten minutes from the port have been verified, the hourly height data are calculated by interpolation with a cubic spline function. The verified hourly data are then published on SONEL.
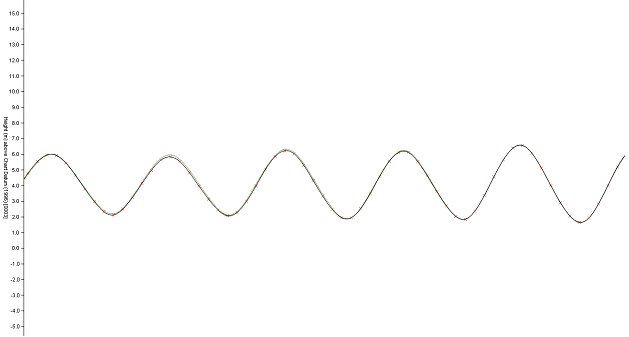
Figure 3 : Plots of the hourly heights (red curve).
3.3.4 Calculation of the mean levels
The mean levels are calculated using the Demerliac filter. They are analysed in relation to atmospheric pressure.
3.3.5 Comparison with neighboring ports
Verification is performed step by step from a simultaneous visualisation of the data from nearby ports, comparing in particular :
– storm surges : the spatial coherence of their distribution along the coast is checked;
– the mean levels : the difference in the mean levels is plotted in order to verify the coherence of the vertical references and detect any datum problem.
3.3.6 Concordance plots
Concordance plots between two ports can sometimes be used to determine the characteristic values and possibly the anomalies.
3.3.7 Annual harmonic analysis
The harmonic analysis of the observations made during the previous year reveal the interannual variability of certain constituents and the detection of certain systematic errors (dating, scale factor, etc.).
4- Types of errors that may be encountered and corrected in the tide gauge data
4.1 Datum shift / offset
Certain datum offsets which occur during data acquisition can occur suddenly due to external causes (a boat hitting the equipment, damage, work on site at the port, a seism, a mistake made during re-calibration etc.). If the offset is large it will be directly visible on the tide gauge plot or by concordance. If the offset is negligible or continuous it will be detected by the analysis of the difference in daily and /or monthly mean levels with those of a nearby tide gauge that is assumed to be stable.
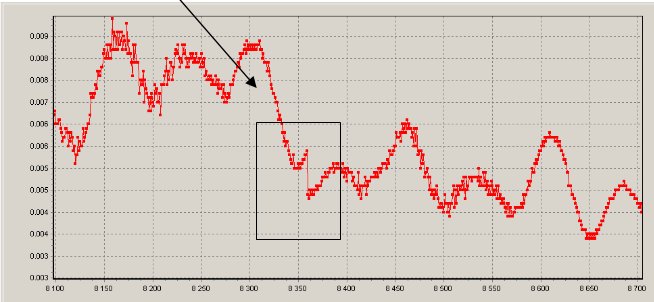
Figure 4 : Example of a plot with a datum offset.
4.2 Occasional outliers, peaks
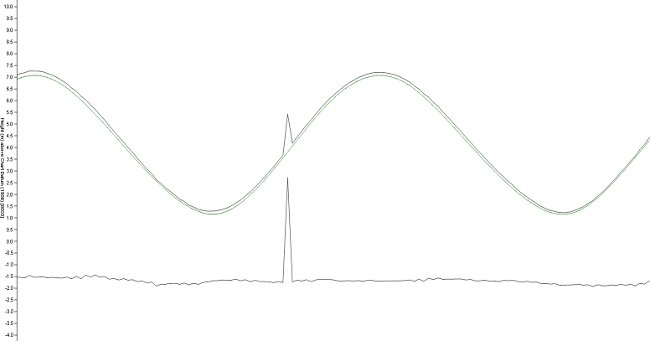
Figure 5 : Example of an occasional shift / outlier.
This kind of error (peaks and/or outlier data) is corrected by interpolation. The erroneous value is replaced by the interpolated value.
4.3 Shift over a long period resulting from a problem with an instrument
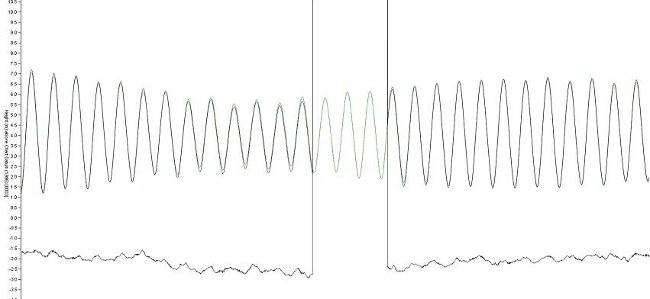
Figure 6 : Shift over a long period.
Correction impossible, the data are therefore invalidated.
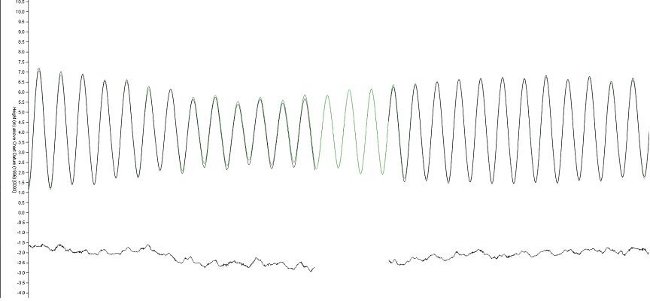
Figure 7 : Example of a shift over a long period after ‘ invalidation’.
4.4 Silting of the stilling tubes or wells
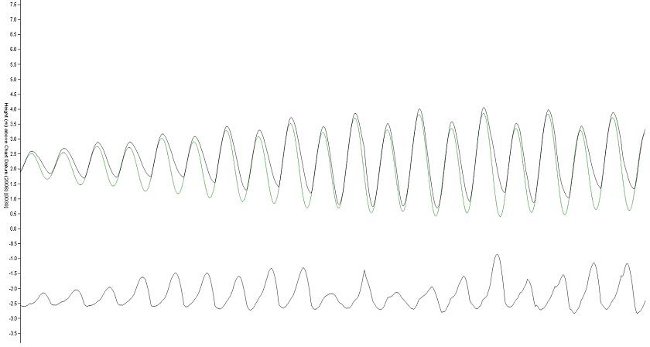
Figure 8 : Example of a plot when silting occurs.
The curve is distorted since the water no longer circulates normally in the tube or the well. In fact, water cannot flow freely through the tube. This phenomenon may be due to a build-up of silt or sand, obstruction by an object etc. here again it is impossible to correct the data which are therefore invalidated and a remark is added. Certain ports that are particularly prone to silting have recently found a way around this problem by installing open air radar tide gauges, without a stilling tube/well.
4.5 Time shift
Instrument dating is tested and if necessary synchronisation performed from SHOM in Brest. The dating accuracy is generally better than the minute. A time shift determined over a well-defined period by checking the data acquisition unit clock, for example, is corrected a posteriori. But mostly abnormal time shifts are not corrected and the data are rejected.
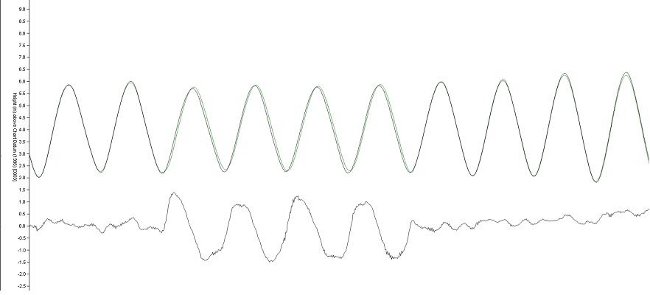
Figure 9 : Example of a plot showing a clock error.
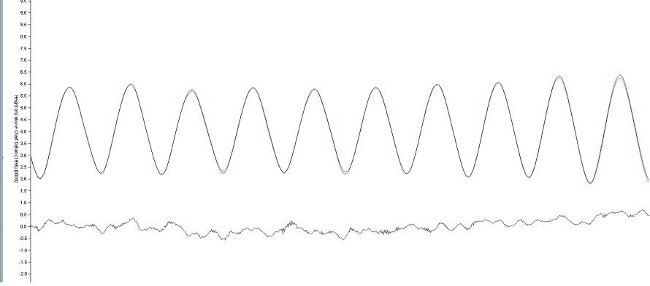
Figure 10 : Example of a plot showing a clock error after correction.
5- Information on the corrections made
For each correction a remark is made in the SHOM data base and the main information published on the SONEL web site.
Moreover, the colour code for the tide gauges on the general map on the SONEL web site allows the users to monitor any problems that arise (breakdown, silting etc.) or a planned remedial action.
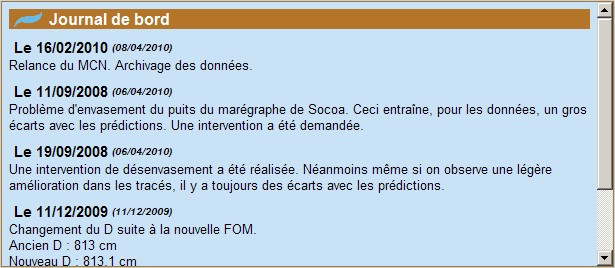
Figure 11 : Sonel Logbook.


