
LEVELING OF CHERBOURG
Benchmark positionning related to the tide gauge station

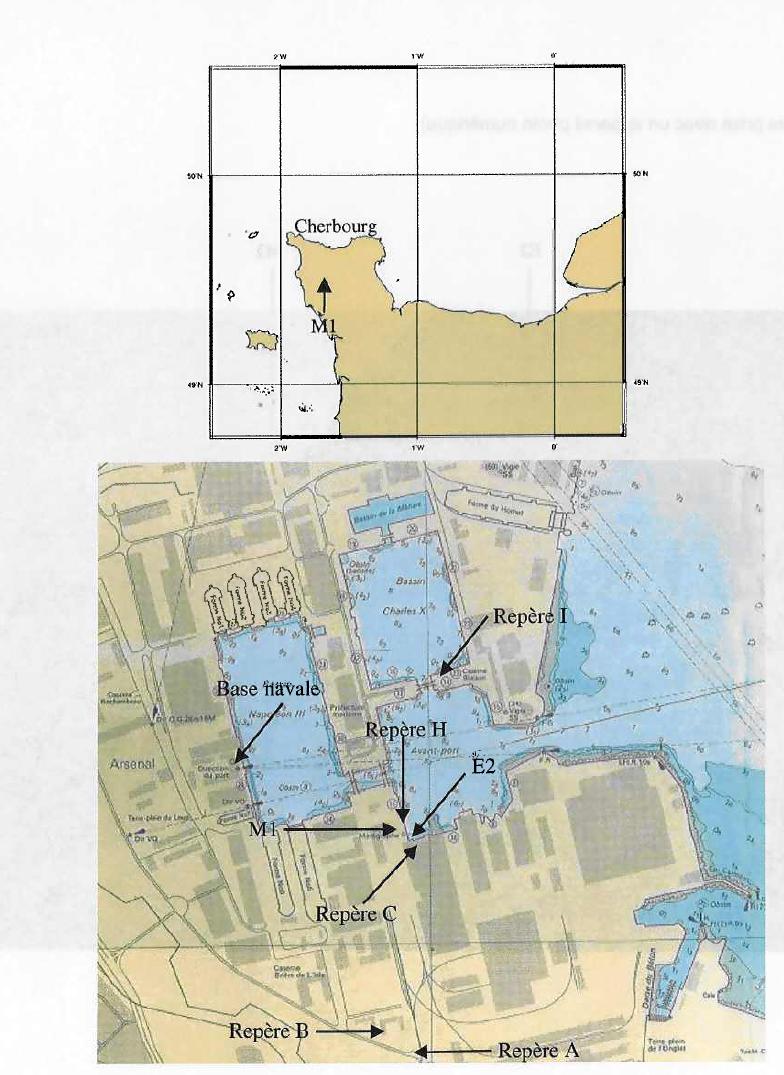
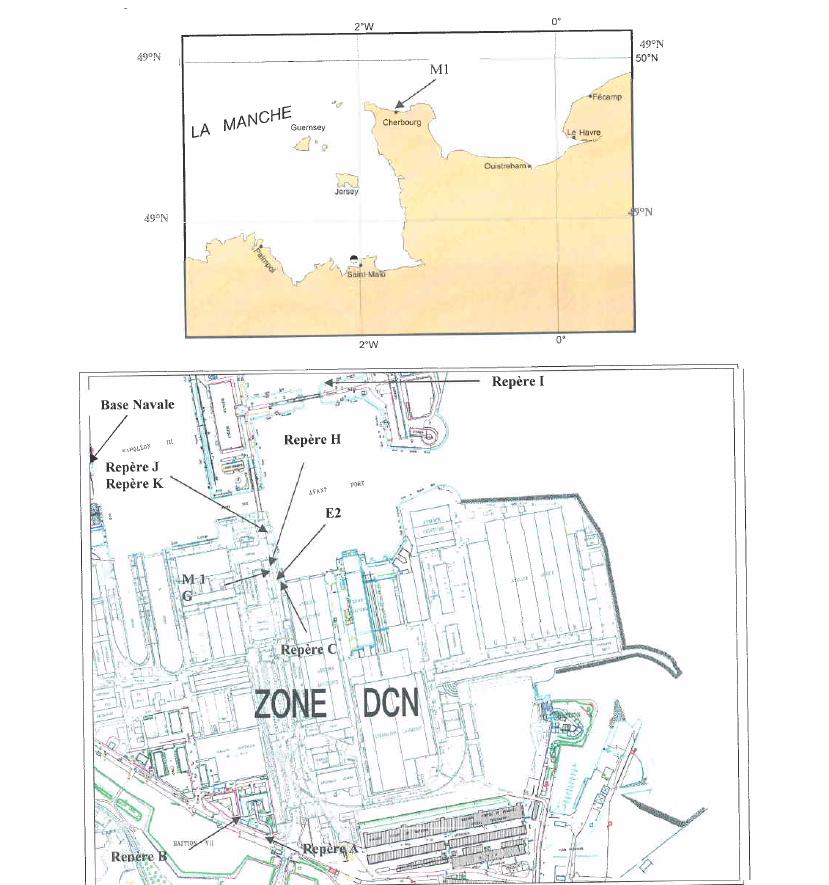
Benchmarks description table
Benchmarks vertical positionning diagram
Reference:
Leveling evolution
| Stand point | E2 | K | K | J | J | I | I | G | A | A | C | C | ||
|---|---|---|---|---|---|---|---|---|---|---|---|---|---|---|
| End point | C | C | H | C | H | H | C | H | B | C | H | B | ||
| Distance (m) | ---- | ---- | ---- | ---- | ---- | ---- | ---- | ---- | 93 | 476 | ---- | 406 | ||
| Height difference (m) | Campaign 8 | 2021-01-12 | --- | --- | --- | --- | --- | --- | --- | --- | --- | --- | --- | --- |
| Campaign 7 | 2018-01-01 | --- | --- | --- | --- | --- | --- | --- | --- | --- | --- | --- | --- | |
| Campaign 6 | 2015-01-01 | --- | --- | --- | --- | --- | --- | --- | --- | --- | --- | --- | --- | |
| Campaign 5 | 2014-04-18 | --- | --- | --- | --- | --- | --- | --- | --- | --- | --- | --- | --- | |
| Campaign 4 | 2013-01-01 | --- | --- | --- | --- | --- | --- | --- | --- | --- | --- | --- | --- | |
| Campaign 3 | 2007-02-21 | 1.3030 ± 0.001 | 0.6340 ± 0.001 | --- | 0.5680 ± 0.001 | --- | 0.8020 ± 0.001 | --- | 0.7590 ± 0.001 | 1.1200 ± 0.001 | 0.0260 ± 0.001 | 0.2800 ± 0.001 | --- | |
| Campaign 2 | 2005-06-20 | --- | --- | 0.9140 ± 0.001 | --- | 0.8480 ± 0.001 | --- | --- | --- | --- | --- | --- | --- | |
| Campaign 1 | 2002-12-06 | 1.3020 ± 0.001 | --- | --- | --- | --- | --- | 0.5180 ± 0.001 | 0.7570 ± 0.001 | 1.1190 ± 0.001 | 0.0230 ± 0.001 | 0.2790 ± 0.001 | 1.0960 ± 0.001 | |
| Height difference evolution graph |  |  |  |  |  |  |  |  |  |  |  |  | ||
Download leveling data
TIDE GAUGE LOCAL LEVELING NETWORK DATA OF STATION CHERBOURG
-----------------------------------------------------------------------------------------------------
Benchmark Lat. Long. Height Year of determination St.dev Distance_to_TG
10chr (°) 14chr (°) 14chr (m) 10chr 22chr (m)10chr (m) 10chr
-----------------------------------------------------------------------------------------------------
C 49.651111 -1.635333 12.530 2021 0.00200 30
A 49.646833 -1.635333 12.500 2021 0.00000 500
B 49.647500 -1.636111 13.622 2021 0.00200 420
E2 ---- ---- 11.225 2021 0.00200 ----
G ---- ---- 12.051 2021 0.00200 ----
H ---- ---- 12.810 2021 0.00100 ----
I ---- ---- 12.008 2021 0.00200 ----
J ---- ---- 11.961 2021 0.00200 ----
K ---- ---- 11.896 2021 0.00200 ----
L ---- ---- 12.966 2021 0.00200 ----
CHTG ---- ---- 11.175 2015 0.00300 ----
CHTG_arp ---- ---- 13.264 2015 0.00300 ----
CHTG_a ---- ---- 11.142 2015 0.00300 ----
N ---- ---- 11.618 2021 0.00200 ----
E3 ---- ---- 11.762 2021 0.00200 ----
Co-located instruments
- Tide Gauge : CHERBOURG (CHERB)
- GPS : Beaumont Hague (BMHG)
- GPS : Héauville (HEAU)
- GPS : CHTG (CHTG)
- GPS : La Hague (LHGE)


