
LEVELING OF DUNKERQUE
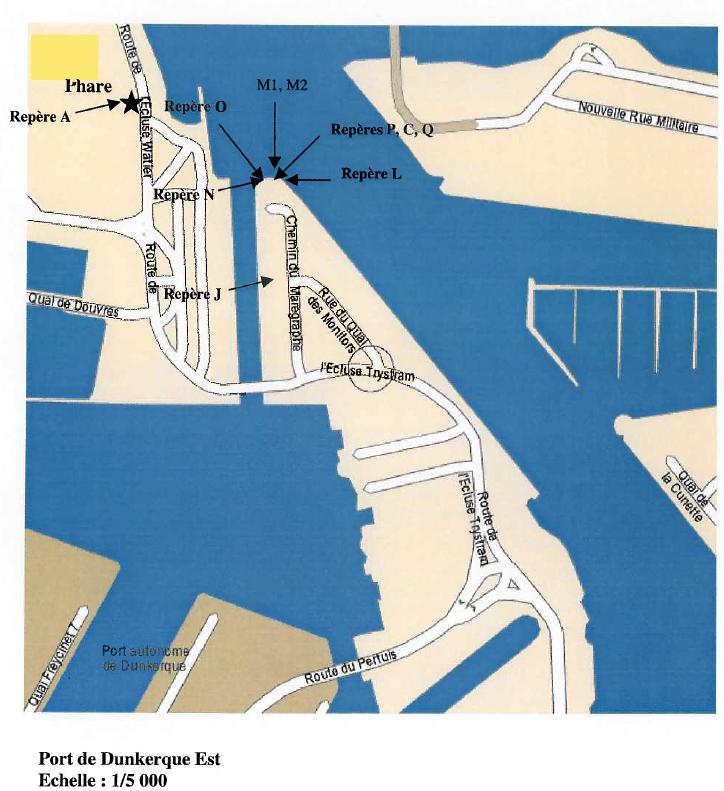
Benchmark positionning related to the tide gauge station
Benchmarks description table
Benchmarks vertical positionning diagram
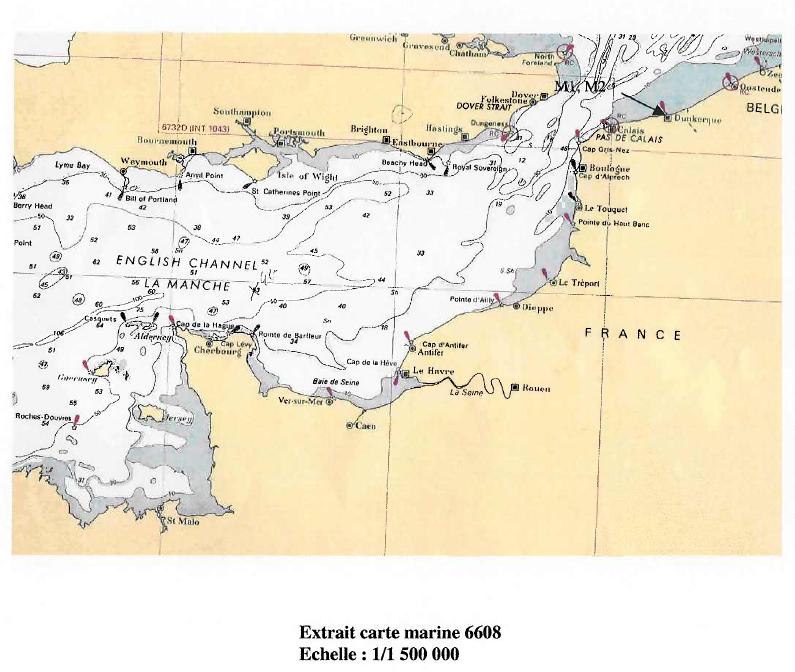
Reference:
Leveling evolution
| Stand point | A | A | A | A | A | A | N | O | P | J | J | J | C | ||
|---|---|---|---|---|---|---|---|---|---|---|---|---|---|---|---|
| End point | J | L | N | O | P | Y | J | J | J | C | L | A | Q | ||
| Distance (m) | ---- | ---- | 139 | ---- | ---- | ---- | ---- | ---- | ---- | ---- | ---- | ---- | ---- | ||
| Height difference (m) | Campaign 7 | 2022-04-25 | --- | --- | --- | --- | --- | --- | --- | --- | --- | --- | --- | --- | --- |
| Campaign 6 | 2021-11-26 | --- | --- | --- | --- | --- | --- | --- | --- | --- | --- | --- | --- | --- | |
| Campaign 5 | 2018-01-01 | --- | --- | --- | --- | --- | --- | --- | --- | --- | --- | --- | --- | --- | |
| Campaign 4 | 2016-09-08 | --- | --- | --- | --- | --- | --- | --- | --- | --- | --- | --- | --- | --- | |
| Campaign 3 | 2013-09-13 | --- | --- | --- | --- | --- | --- | --- | --- | --- | --- | --- | --- | --- | |
| Campaign 2 | 2013-02-28 | -1.1908 ± 0.001 | -0.8636 ± 0.001 | -1.5944 ± 0.001 | -1.4980 ± 0.001 | -1.4467 ± 0.001 | 0.7367 ± 0.001 | --- | --- | --- | --- | --- | --- | --- | |
| Campaign 1 | 2003-11-13 | --- | --- | --- | --- | --- | --- | 0.4090 ± 0.001 | 0.3090 ± 0.001 | 0.2570 ± 0.001 | 0.0820 ± 0.001 | 0.3280 ± 0.001 | 1.1930 ± 0.001 | 0.1750 ± 0.01 | |
| Height difference evolution graph |  |  |  |  |  |  |  |  |  |  |  |  |  | ||
Download leveling data
TIDE GAUGE LOCAL LEVELING NETWORK DATA OF STATION DUNKERQUE
-----------------------------------------------------------------------------------------------------
Benchmark Lat. Long. Height Year of determination St.dev Distance_to_TG
10chr (°) 14chr (°) 14chr (m) 10chr 22chr (m)10chr (m) 10chr
-----------------------------------------------------------------------------------------------------
A 51.048611 2.364750 13.200 2022 0.00000 150
C ---- ---- 12.089 2003 0.00100 ----
J ---- ---- 12.010 2022 0.00100 ----
L ---- ---- 12.337 2022 0.00100 ----
N 51.048092 2.366557 11.606 2013 0.00100 10
O ---- ---- 11.702 2013 0.00100 ----
P ---- ---- 11.753 2022 0.00100 ----
Q ---- ---- 12.264 2003 0.01100 ----
Y ---- ---- 13.937 2022 0.00100 ----
R ---- ---- 12.099 2022 0.00100 ----
S ---- ---- 11.594 2022 0.00100 ----
T ---- ---- 12.483 2022 0.00100 ----
V ---- ---- 12.093 2022 0.00100 ----
X ---- ---- 11.542 2022 0.00100 ----
G ---- ---- 11.876 2022 0.00200 ----
H ---- ---- 12.064 2022 0.00200 ----
DUNQ_ARP ---- ---- 16.119 2021 0.00200 ----
B ---- ---- ---- ---- ---- ----
D ---- ---- 12.095 2013 0.00100 ----
F ---- ---- ---- ---- ---- ----
I ---- ---- 11.697 2013 0.00000 ----
K ---- ---- ---- ---- ---- ----
Co-located instruments
- Tide Gauge : DUNKERQUE (DUNKE)
- GPS : Coudekerque-Branche (COUD)
- GPS : Dunkerque Grand Littoral Géomatique (DGLG)
- GPS : Dunkerque (DUNQ)
- GPS : Coudekerque-Branche (COU2)


