
LEVELING OF LE CONQUET
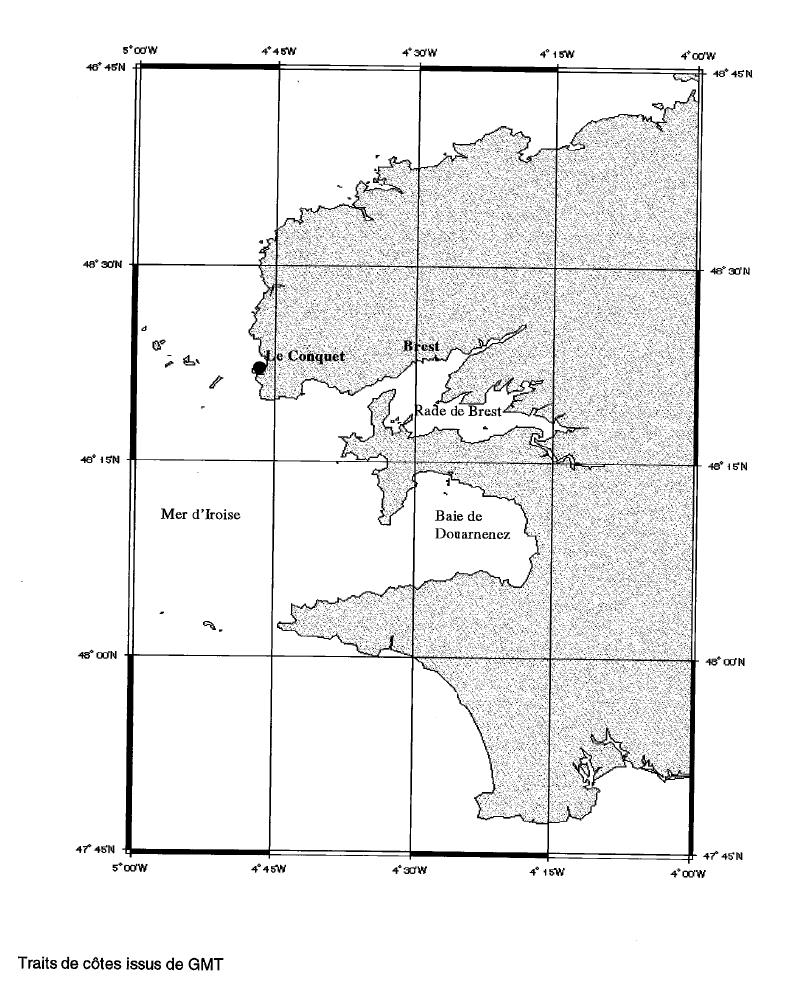
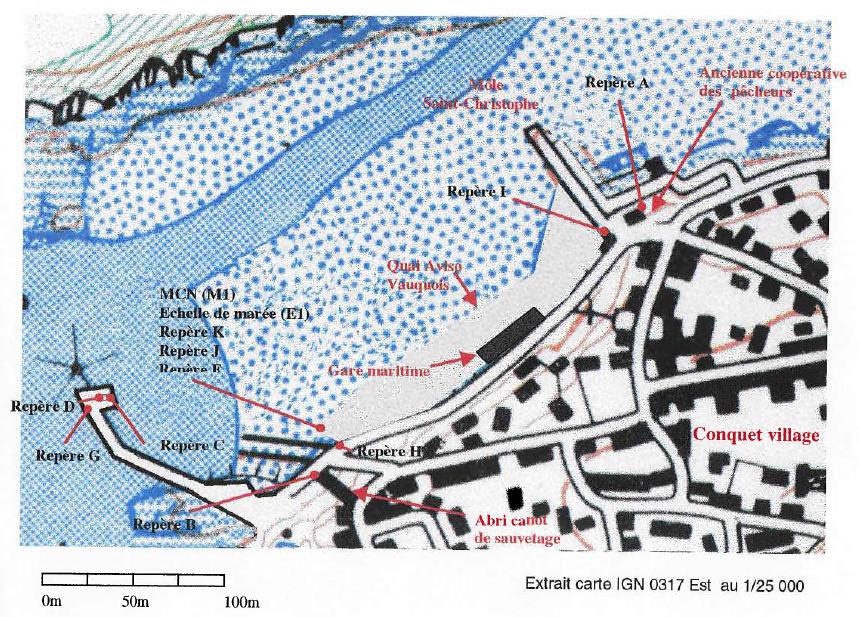
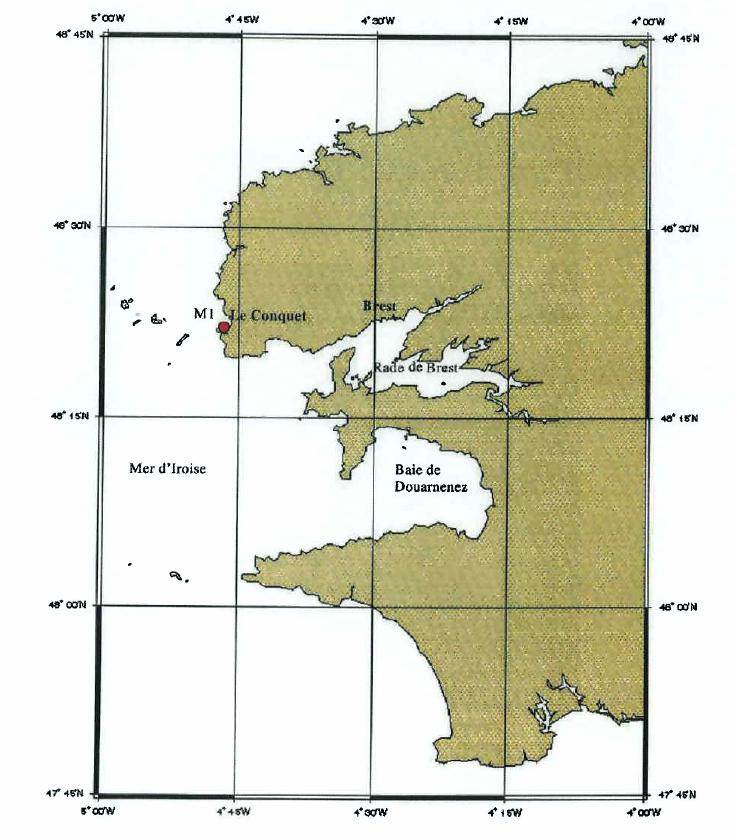
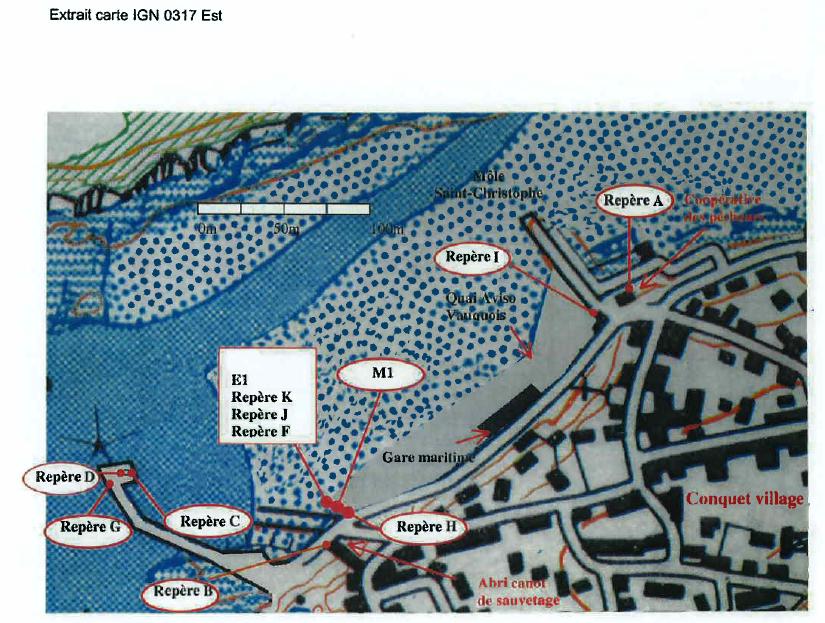
Benchmark positionning related to the tide gauge station
Benchmarks description table
Benchmarks vertical positionning diagram
Reference:
Leveling evolution
| Stand point | G | G | G | H | H | H | H | H | H | H | I | F | F | J | K | B | ||
|---|---|---|---|---|---|---|---|---|---|---|---|---|---|---|---|---|---|---|
| End point | D | C | B | I | F | J | K | C | D | B | A | B | J | B | B | A | ||
| Distance (m) | 14 | 13 | 193 | 316 | ---- | ---- | ---- | 184 | 182 | 10 | 33 | ---- | ---- | ---- | ---- | 341 | ||
| Height difference (m) | Campaign 6 | 2025-05-14 | --- | --- | --- | --- | --- | --- | --- | --- | --- | --- | --- | --- | --- | --- | --- | --- |
| Campaign 5 | 2021-06-14 | --- | --- | --- | --- | --- | --- | --- | --- | --- | --- | --- | --- | --- | --- | --- | --- | |
| Campaign 4 | 2016-06-13 | --- | --- | --- | --- | --- | --- | --- | --- | --- | --- | --- | --- | --- | --- | --- | --- | |
| Campaign 3 | 2014-10-20 | --- | --- | --- | --- | --- | --- | --- | --- | --- | --- | --- | --- | --- | --- | --- | --- | |
| Campaign 2 | 2006-06-27 | 1.0600 ± 0.001 | 0.8840 ± 0.001 | 1.7540 ± 0.001 | 0.7780 ± 0.001 | 0.1760 ± 0.001 | 0.8280 ± 0.001 | 0.3490 ± 0.001 | --- | --- | --- | 10.7410 ± 0.001 | 1.3730 ± 0.001 | --- | 0.7210 ± 0.001 | 1.2000 ± 0.001 | 9.9700 ± 0.001 | |
| Campaign 1 | 2002-03-06 | 1.0520 ± 0.001 | 0.8750 ± 0.001 | --- | 0.7800 ± 0.001 | 0.1760 ± 0.001 | --- | 0.3300 ± 0.001 | 0.6670 ± 0.001 | 0.8540 ± 0.001 | 1.5480 ± 0.001 | 10.7360 ± 0.001 | 1.3720 ± 0.001 | 0.6520 ± 0.001 | 0.7200 ± 0.001 | 1.2180 ± 0.001 | 9.9680 ± 0.001 | |
| Height difference evolution graph |  |  |  |  |  |  |  |  |  |  |  |  |  |  |  |  | ||
Download leveling data
TIDE GAUGE LOCAL LEVELING NETWORK DATA OF STATION LE_CONQUET
-----------------------------------------------------------------------------------------------------
Benchmark Lat. Long. Height Year of determination St.dev Distance_to_TG
10chr (°) 14chr (°) 14chr (m) 10chr 22chr (m)10chr (m) 10chr
-----------------------------------------------------------------------------------------------------
A 48.360917 -4.776722 23.395 2025 0.00000 360
B 48.358972 -4.780278 13.422 2021 0.00100 40
C 48.359583 -4.782722 12.549 2021 0.00100 150
D 48.359583 -4.782694 12.726 2021 0.00100 150
F ---- ---- 12.046 2021 0.00100 ----
G 48.359472 -4.782778 11.635 2021 0.00100 150
H 48.359028 -4.780389 11.869 2021 0.00100 30
I 48.360889 -4.777167 12.653 2021 0.00100 330
J ---- ---- 12.698 2021 0.00100 ----
K ---- ---- 12.225 2021 0.00100 ----
L ---- ---- 12.241 2025 0.00100 ----
N ---- ---- 15.367 2021 0.00100 ----
Co-located instruments
- Tide Gauge : LE_CONQUET (LCONQ)
- GPS : Lampaul Plouarzel (LPPZ)


