
LEVELING OF KERGUELEN ISLANDS
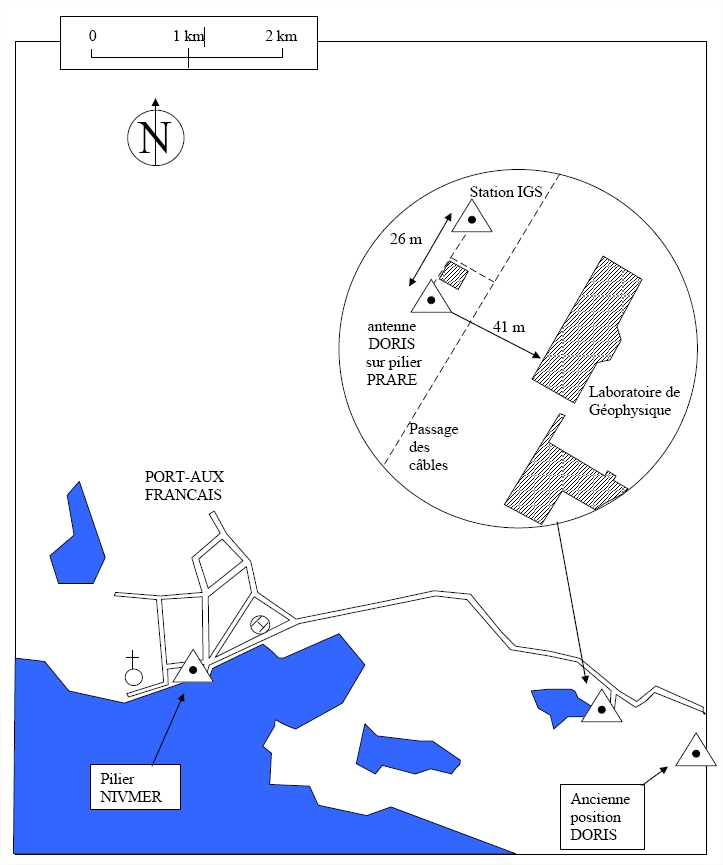
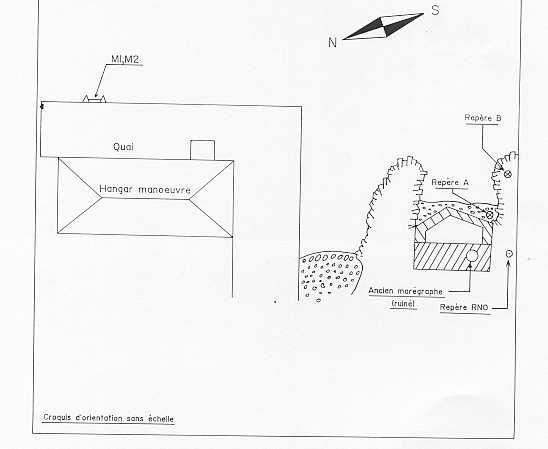
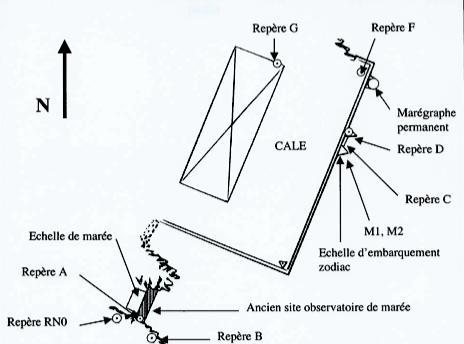
Benchmark positionning related to the tide gauge station

Benchmarks description table
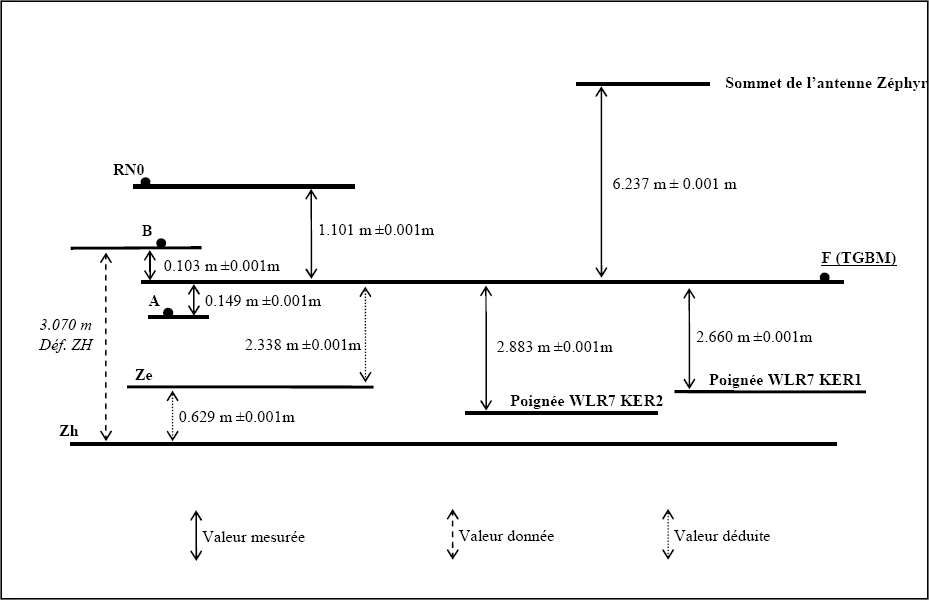
Benchmarks vertical positionning diagram
Reference:
Leveling evolution
| Stand point | F | F | F | F | F | RN0 | RN0 | RN0 | B | B | B | B | B | B | KERG | DORIS/mark2 | G | KERB | ||
|---|---|---|---|---|---|---|---|---|---|---|---|---|---|---|---|---|---|---|---|---|
| End point | G | A | B | RN0 | NIVMER/vis | B | KETG | NIVMER/vis | A | RN0 | C | D | F | G | DORIS/mark2 | KESB | NIVMER/vis | DORIS/mark1 | ||
| Distance (m) | ---- | ---- | ---- | ---- | 78 | ---- | ---- | ---- | ---- | ---- | ---- | ---- | ---- | ---- | 26 | 0 | ---- | 0 | ||
| Height difference (m) | Campaign 9 | 2023-04-04 | --- | --- | --- | --- | --- | --- | --- | --- | --- | --- | --- | --- | --- | --- | --- | --- | --- | --- |
| Campaign 8 | 2022-04-02 | --- | --- | --- | --- | --- | --- | --- | --- | --- | --- | --- | --- | --- | --- | --- | --- | --- | --- | |
| Campaign 7 | 2016-01-18 | --- | --- | --- | --- | --- | --- | --- | --- | --- | --- | --- | --- | --- | --- | --- | --- | --- | --- | |
| Campaign 6 | 2014-03-24 | --- | --- | --- | --- | --- | --- | --- | --- | --- | --- | --- | --- | --- | --- | --- | --- | --- | --- | |
| Campaign 5 | 2008-11-14 | 0.5190 ± 0.001 | -0.1490 ± 0.001 | 0.1030 ± 0.001 | 1.1010 ± 0.001 | --- | -0.9970 ± 0.001 | 6.2790 ± 0.001 | --- | -0.2520 ± 0.001 | --- | --- | --- | --- | --- | --- | --- | --- | --- | |
| Campaign 4 | 2007-04-11 | --- | --- | --- | --- | --- | --- | --- | --- | --- | --- | --- | --- | --- | --- | 0.8260 ± 0.001 | 0.4900 ± 0.001 | --- | --- | |
| Campaign 3 | 2003-12-15 | 0.5175 ± 0.001 | --- | --- | --- | --- | --- | --- | 5.0149 ± 0.001 | --- | --- | --- | --- | --- | --- | --- | --- | --- | --- | |
| Campaign 2 | 2003-09-22 | --- | --- | --- | --- | --- | --- | --- | --- | -0.2480 ± 0.001 | 0.9990 ± 0.001 | -0.4240 ± 0.005 | -0.3080 ± 0.001 | -0.1020 ± 0.001 | 0.4150 ± 0.001 | --- | --- | --- | --- | |
| Campaign 1 | 2001-04-02 | --- | --- | --- | --- | 6.1137 ± 0.001 | --- | --- | --- | --- | --- | --- | --- | --- | --- | 0.8260 ± 0.001 | --- | 5.5960 ± 0.001 | -2.4430 ± 0.001 | |
| Height difference evolution graph |  |  |  |  |  |  |  |  |  |  |  |  |  |  |  |  |  |  | ||
Download leveling data
TIDE GAUGE LOCAL LEVELING NETWORK DATA OF STATION Kerguelen Islands
-----------------------------------------------------------------------------------------------------
Benchmark Lat. Long. Height Year of determination St.dev Distance_to_TG
10chr (°) 14chr (°) 14chr (m) 10chr 22chr (m)10chr (m) 10chr
-----------------------------------------------------------------------------------------------------
KERB -49.352085 70.262701 30.468 2007 0.00200 530
DORIS/mark-49.352085 70.262701 28.025 2007 0.00200 530
KESB -49.351697 70.255470 42.162 2007 0.00300 30
DORIS/mark-49.351697 70.255470 35.802 2022 0.00200 30
NIVMER/vis-49.352183 70.217937 9.166 2022 0.00200 2730
NIVMER/cap-49.352183 70.217937 15.021 2007 0.00300 2730
KERG -49.351467 70.255521 34.972 2022 0.00200 0
KETB -49.351697 70.255470 42.480 2007 0.00300 30
F -49.352146 70.219008 2.967 2023 0.00000 2650
G ---- ---- 3.485 2023 0.00100 ----
RN0 ---- ---- 4.029 2023 0.00100 ----
A ---- ---- 2.819 2023 0.00100 ----
B ---- ---- 3.068 2023 0.00100 ----
C ---- ---- 8.576 2003 0.00500 ----
KETG ---- ---- 9.146 2022 0.00100 ----
Zr2 -49.352200 70.219002 4.069 2022 0.00100 2650
Zr3 -49.352181 70.218981 2.955 2022 0.00100 2660
N -49.352200 70.219002 4.087 2022 0.00200 2650
O -49.352181 70.218981 2.973 2023 0.00100 2660
L -49.352206 70.217927 8.113 2023 0.00100 2730
M -49.352214 70.218963 2.785 2023 0.00100 2660
0 échelle ---- ---- 6.562 2016 0.00200 ----
KRGG -49.352183 70.217937 34.927 2022 0.00200 2730
98404K4 49.349951 70.210197 17.374 2023 0.00200 9631530
D ---- ---- 8.692 2003 0.00100 ----
H ---- ---- 15.022 2003 0.00100 ----
Co-located instruments
- GPS : Kerguelen Islands (KERG)
- Tide Gauge : KERGUELEN (KERGU)
- GPS : Kerguelen Island 2 (KRGG)
- GPS : Kerguelen - Pilier NIVMER (KETG)
- GPS : Kerguelen Reflectometry (KERR)
- Doris : KERGUELEN (KEWC)


