
LEVELING OF NOUMEA
Benchmark positionning related to the tide gauge station

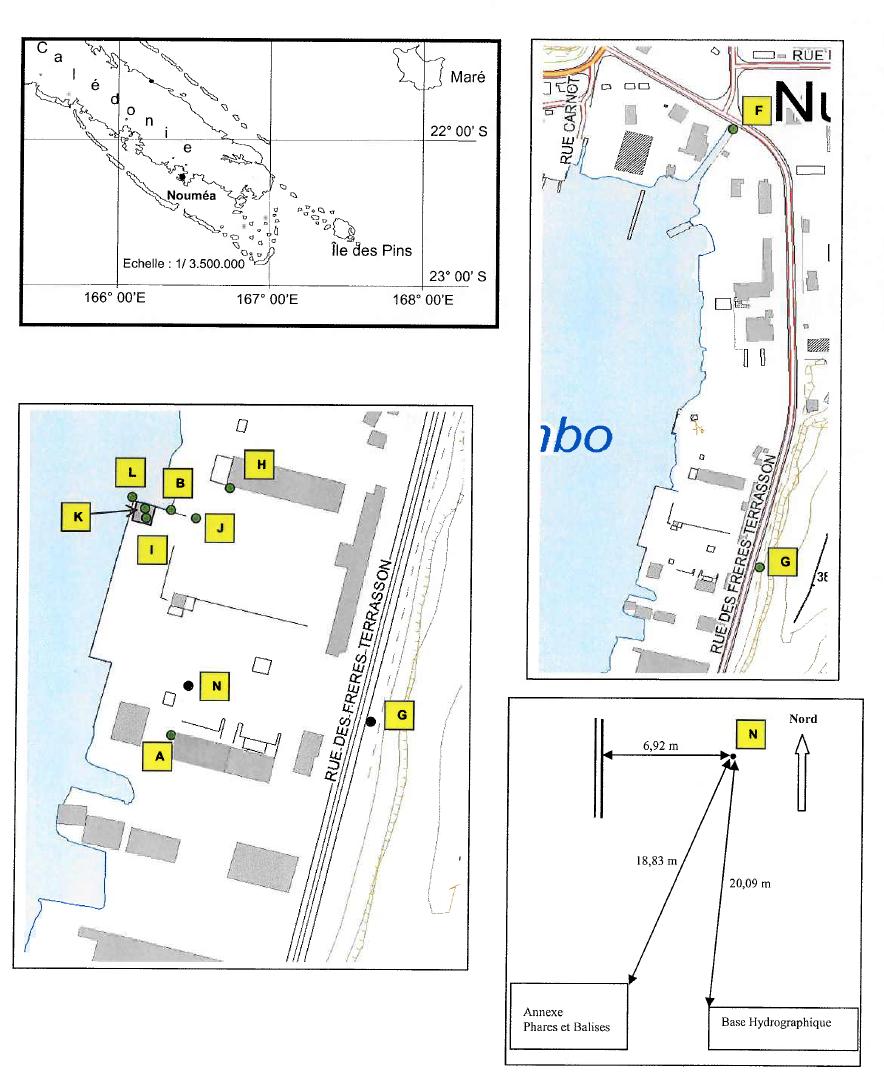
Benchmarks description table
Benchmarks vertical positionning diagram
Reference:
Leveling evolution
| Stand point | L | F | F | B | B | B | N | N | N | J | J | J | J | D | C | ||
|---|---|---|---|---|---|---|---|---|---|---|---|---|---|---|---|---|---|
| End point | J | G | B | H | J | C | J | G | A | H | K | I | G | B | A | ||
| Distance (m) | ---- | ---- | ---- | ---- | ---- | ---- | ---- | ---- | ---- | ---- | ---- | ---- | ---- | ---- | ---- | ||
| Height difference (m) | Campaign 5 | 2020-02-28 | --- | --- | --- | --- | --- | --- | --- | --- | --- | --- | --- | --- | --- | --- | --- |
| Campaign 4 | 2015-08-07 | --- | --- | --- | --- | --- | --- | --- | --- | --- | --- | --- | --- | --- | --- | --- | |
| Campaign 3 | 2006-03-17 | 1.1760 ± 0.001 | 1.9330 ± 0.001 | --- | 0.6410 ± 0.001 | 0.3670 ± 0.001 | --- | 0.0310 ± 0.001 | 1.2240 ± 0.001 | 0.2980 ± 0.001 | 0.2740 ± 0.001 | 0.4690 ± 0.001 | 3.2980 ± 0.001 | 1.1930 ± 0.001 | --- | --- | |
| Campaign 2 | 2005-08-23 | --- | --- | --- | --- | --- | --- | --- | --- | --- | --- | --- | --- | --- | --- | --- | |
| Campaign 1 | 2001-01-01 | --- | --- | 0.3690 ± 0.001 | --- | --- | 0.3320 ± 0.001 | --- | --- | --- | --- | --- | --- | --- | 0.0690 ± 0.001 | 0.3020 ± 0.001 | |
| Height difference evolution graph |  |  |  |  |  |  |  |  |  |  |  |  |  |  |  | ||
Download leveling data
TIDE GAUGE LOCAL LEVELING NETWORK DATA OF STATION NOUMEA
-----------------------------------------------------------------------------------------------------
Benchmark Lat. Long. Height Year of determination St.dev Distance_to_TG
10chr (°) 14chr (°) 14chr (m) 10chr 22chr (m)10chr (m) 10chr
-----------------------------------------------------------------------------------------------------
F ---- ---- 8.464 2020 0.00200 ----
A ---- ---- 9.474 2020 0.00200 ----
B ---- ---- 8.840 2020 0.00200 ----
C ---- ---- 3.149 2001 0.00200 ----
D ---- ---- 2.748 2001 0.00200 ----
G ---- ---- 10.400 2020 0.00000 ----
H ---- ---- 9.479 2020 0.00200 ----
I ---- ---- 12.506 2020 0.00200 ----
J ---- ---- 9.202 2020 0.00200 ----
K ---- ---- 9.676 2020 0.00200 ----
L ---- ---- 7.984 2020 0.00200 ----
N ---- ---- 9.174 2020 0.00200 ----
NOWB -22.228438 166.484894 ---- ---- ---- 8960
NOWB/mark -22.228438 166.484894 ---- ---- ---- 8960
NOUB -22.269842 166.410057 ---- ---- ---- 10
NOUM -22.269854 166.410200 ---- ---- ---- 0
P ---- ---- 8.832 2020 0.00200 ----
Q ---- ---- 9.269 2020 0.00200 ----
R ---- ---- 12.656 2020 0.00200 ----
S ---- ---- 11.797 2020 0.00200 ----
T ---- ---- 9.480 2020 0.00200 ----
U ---- ---- 12.622 2020 0.00200 ----
V ---- ---- 8.789 2020 0.00200 ----
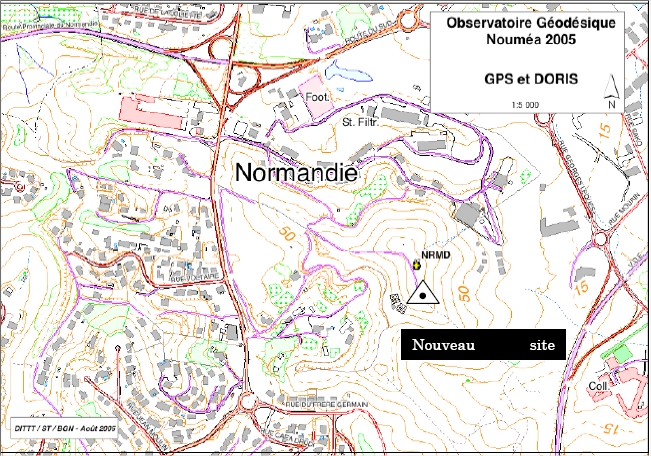
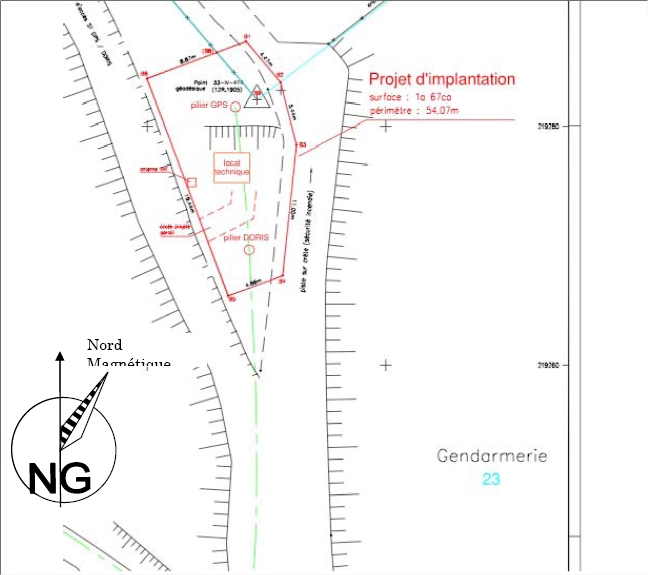
Co-located instruments
- GPS : NOUMEA (NOUM)
- Tide Gauge : NOUMEA-CHALEIX (NOUME)
- Tide Gauge : NOUMEA-NUMBO (NUMBO)
- GPS : NOUMEA (NRMD)
- GPS : NOUMEA NORMANDIE (NRMG)
- GPS : NBTG (NBTG)
- Doris : NOUMEA (NOXC)


