
LEVELING OF PORT BLOC
Benchmark positionning related to the tide gauge station
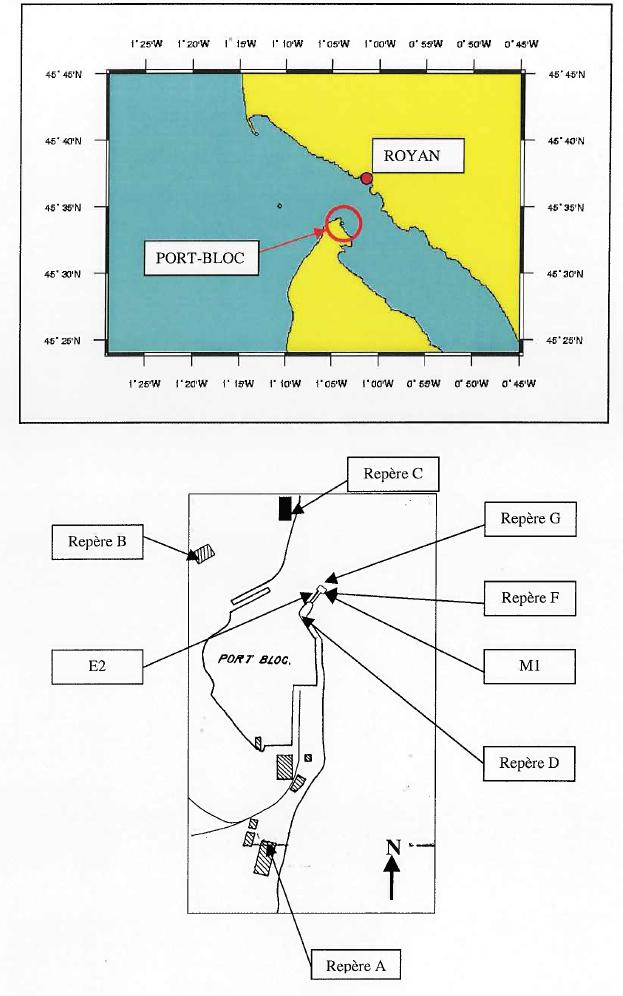
Benchmarks description table
Benchmarks vertical positionning diagram
Reference:
Leveling evolution


Download leveling data
TIDE GAUGE LOCAL LEVELING NETWORK DATA OF STATION PORT_BLOC
-----------------------------------------------------------------------------------------------------
Benchmark Lat. Long. Height Year of determination St.dev Distance_to_TG
10chr (°) 14chr (°) 14chr (m) 10chr 22chr (m)10chr (m) 10chr
-----------------------------------------------------------------------------------------------------
A 45.562944 -1.061972 7.808 2014 0.00000 620
B 45.568583 -1.065500 7.295 2014 0.00200 310
C 45.571833 -1.061889 8.759 2014 0.00300 370
D ---- ---- 6.759 2014 0.00100 ----
F ---- ---- 11.135 2003 0.00200 ----
G ---- ---- 6.953 2014 0.00100 ----
H ---- ---- 7.114 2014 0.00100 ----
I ---- ---- 7.832 2014 0.00100 ----
Co-located instruments
- Tide Gauge : PORT_BLOC (PBLOC)


