LEVELING OF SOLOMON ISLANDS (HONIARA)
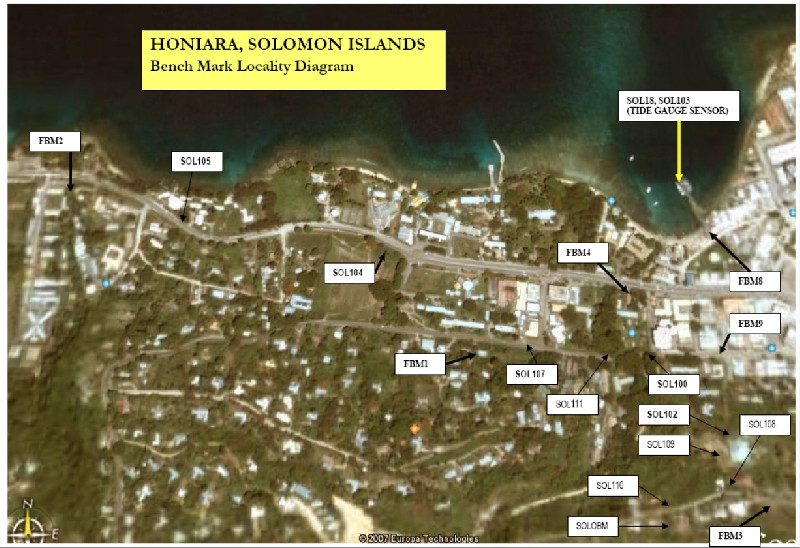
Benchmark positionning related to the tide gauge station

Benchmarks description table
Benchmarks vertical positionning diagram
Reference:
Leveling evolution
| Stand point | FBM4 | FBM4 | FBM4 | FBM4 | FBM4 | FBM4 | FBM4 | FBM4 | FBM4 | FBM4 | FBM4 | FBM4 | ||
|---|---|---|---|---|---|---|---|---|---|---|---|---|---|---|
| End point | FBM1 | FBM3 | SOL18 | SOL103 | FBM8 | FBM9 | SOLOBM | SOLO | RM1 | RM2 | RM3 | FBM2 | ||
| Distance (m) | ---- | ---- | ---- | ---- | ---- | ---- | ---- | ---- | ---- | ---- | ---- | ---- | ||
| Height difference (m) | Campaign 6 | 2009-05-27 | 2.7666 ± 0.001 | 50.4288 ± 0.001 | -0.0479 ± 0.001 | -1.3112 ± 0.001 | -1.6571 ± 0.001 | 1.1305 ± 0.001 | 50.6937 ± 0.001 | 52.1604 ± 0.001 | 50.6249 ± 0.001 | 49.3983 ± 0.001 | 50.1363 ± 0.001 | --- |
| Campaign 5 | 2007-09-13 | 2.7669 ± 0.001 | 50.4270 ± 0.001 | -0.0477 ± 0.001 | -1.3104 ± 0.001 | -1.6571 ± 0.001 | 1.1303 ± 0.001 | 50.6914 ± 0.001 | 52.1559 ± 0.001 | 50.6229 ± 0.001 | 49.3960 ± 0.001 | 50.1339 ± 0.001 | -0.3020 ± 0.001 | |
| Campaign 4 | 1999-04-20 | 2.7659 ± 0.001 | 50.4247 ± 0.001 | -0.0455 ± 0.001 | --- | --- | --- | --- | --- | --- | --- | --- | -0.3036 ± 0.001 | |
| Campaign 3 | 1997-09-13 | 2.7660 ± 0.001 | 50.4252 ± 0.001 | -0.0456 ± 0.001 | --- | --- | --- | --- | --- | --- | --- | --- | -0.3015 ± 0.001 | |
| Campaign 2 | 1996-03-14 | 2.7651 ± 0.001 | 50.4260 ± 0.001 | -0.0438 ± 0.001 | --- | --- | --- | --- | --- | --- | --- | --- | -0.3022 ± 0.001 | |
| Campaign 1 | 1994-09-13 | 2.7663 ± 0.001 | 50.4263 ± 0.001 | -0.0442 ± 0.001 | --- | --- | --- | --- | --- | --- | --- | --- | -0.3026 ± 0.001 | |
| Height difference evolution graph |  |  |  |  |  |  |  |  |  |  |  |  | ||
Download leveling data
TIDE GAUGE LOCAL LEVELING NETWORK DATA OF STATION SOLOMON ISLANDS
-----------------------------------------------------------------------------------------------------
Benchmark Lat. Long. Height Year of determination St.dev Distance_to_TG
10chr (°) 14chr (°) 14chr (m) 10chr 22chr (m)10chr (m) 10chr
-----------------------------------------------------------------------------------------------------
FBM4 ---- ---- 10.600 2009 0.00000 ----
FBM1 ---- ---- 13.367 2009 0.00100 ----
FBM2 ---- ---- 10.298 2007 0.00100 ----
FBM3 ---- ---- 61.029 2009 0.00100 ----
SOL18 ---- ---- 10.552 2009 0.00100 ----
SOL103 ---- ---- 9.289 2009 0.00100 ----
FBM8 ---- ---- 8.943 2009 0.00100 ----
FBM9 ---- ---- 11.730 2009 0.00100 ----
SOLOBM ---- ---- 61.294 2009 0.00100 ----
SOLO ---- ---- 62.760 2009 0.00100 ----
RM1 ---- ---- 61.225 2009 0.00100 ----
RM2 ---- ---- 59.998 2009 0.00100 ----
RM3 ---- ---- 60.736 2009 0.00100 ----
Co-located instruments
- GPS : SOLOMON ISLANDS (SOLO)
- Tide Gauge : HONIARA B (SOLTG)
- Tide Gauge : HONIARA II (HONI2)
Photo album