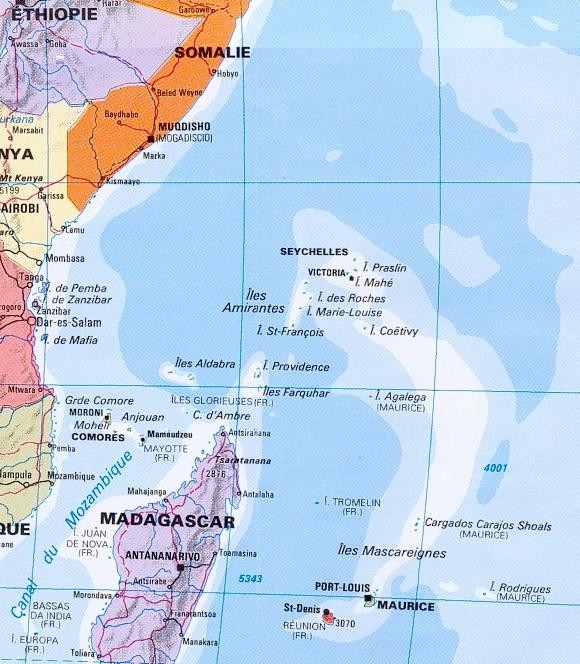
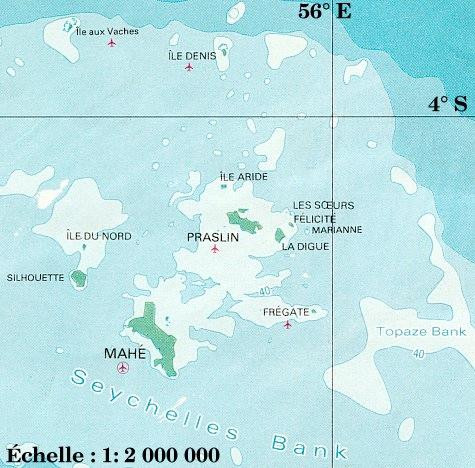
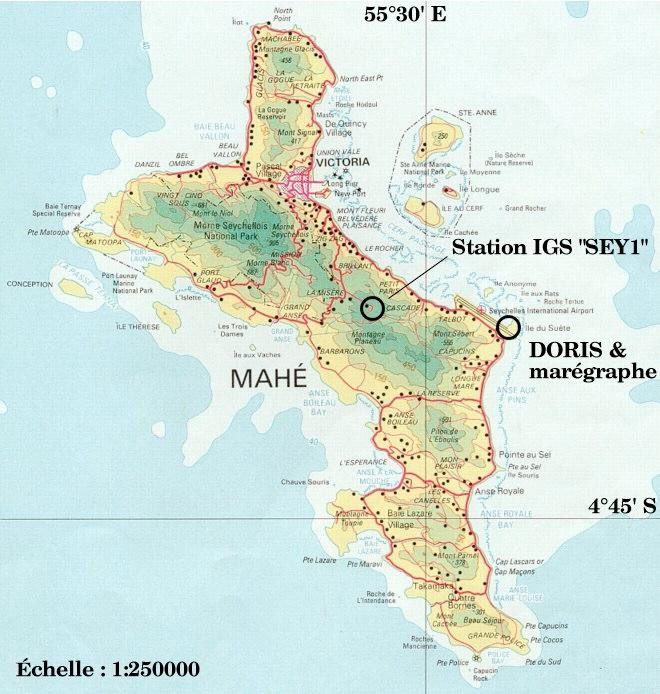
LEVELING OF SEYCHELLES
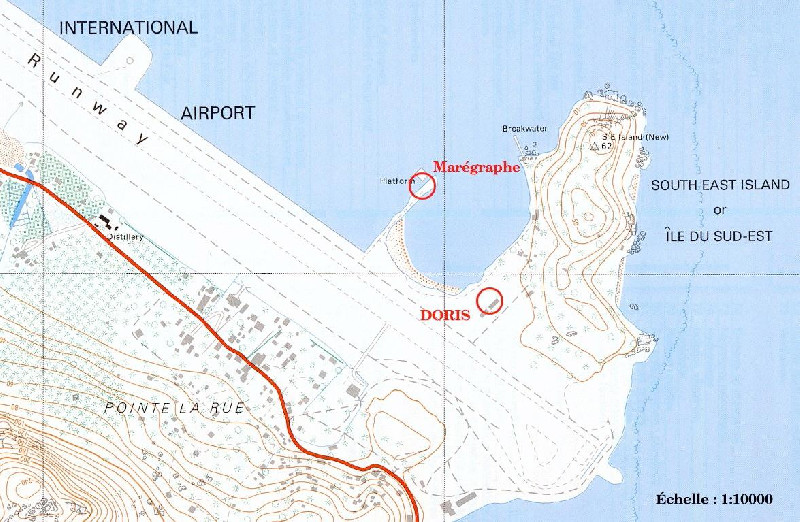
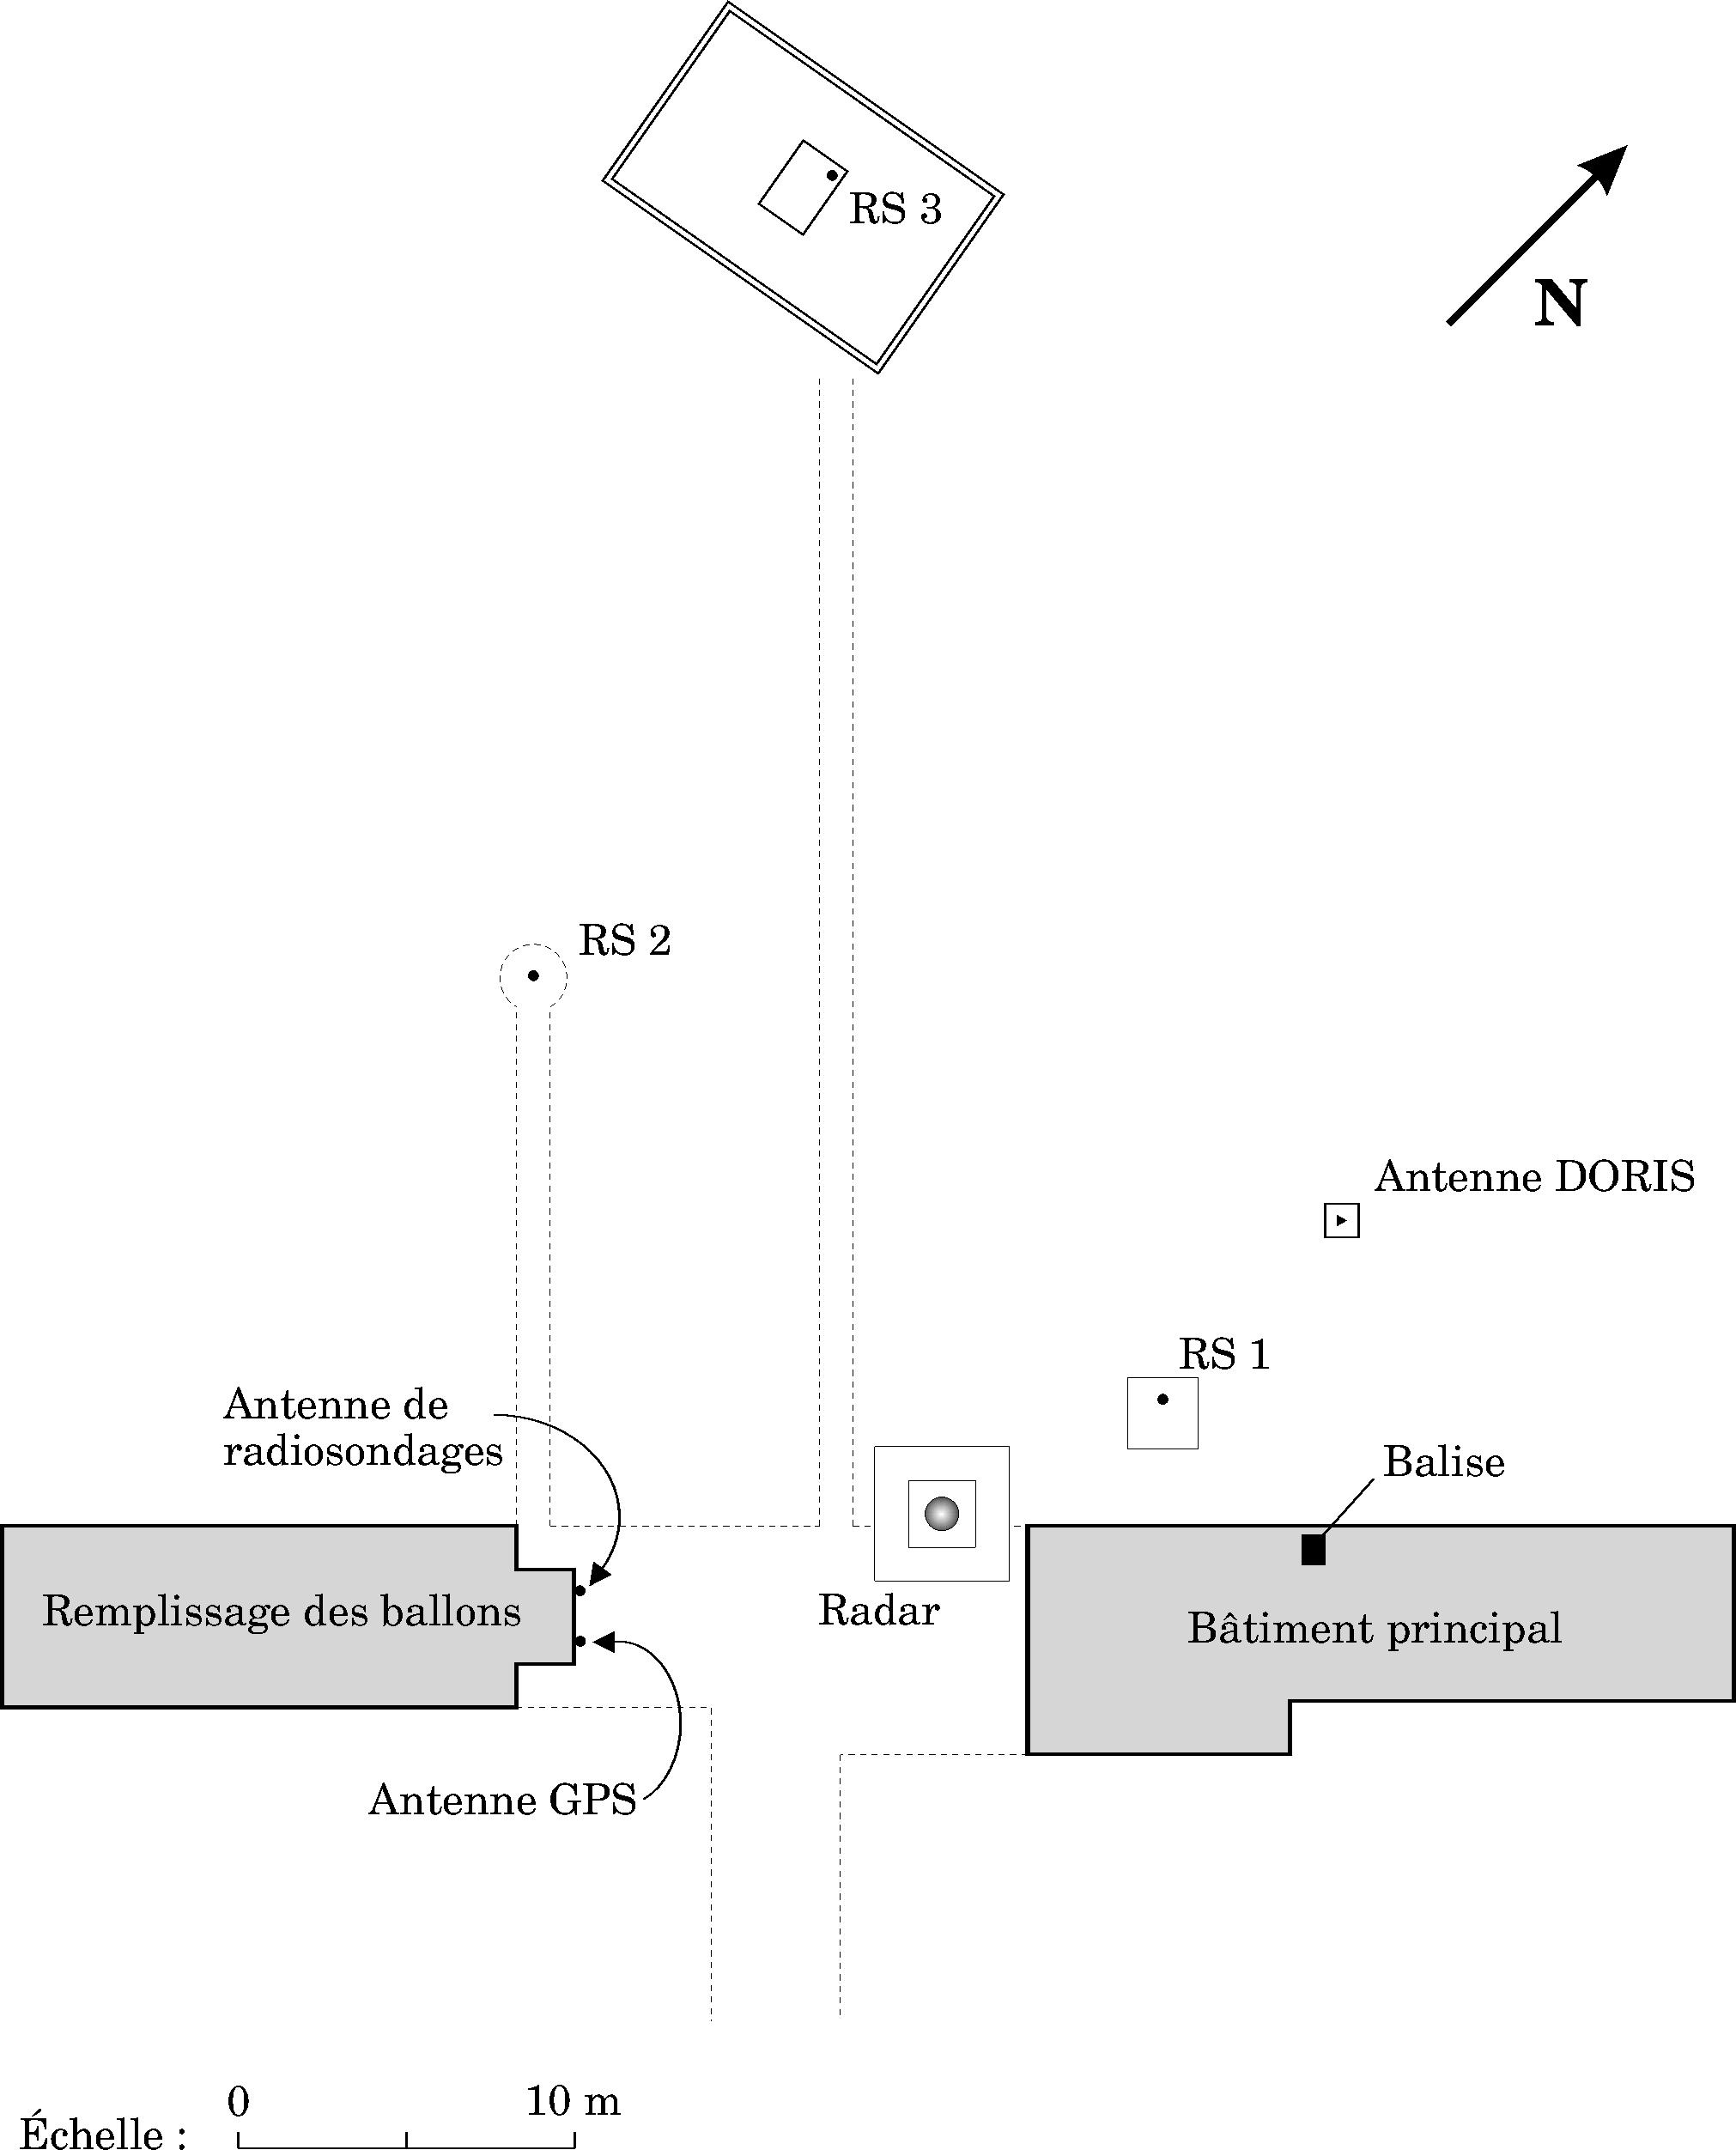
Benchmark positionning related to the tide gauge station
Benchmarks description table
Benchmarks vertical positionning diagram
Reference:
Leveling evolution
| Stand point | UH1 | UH1 | UH1 | UH1 | UH1 | UH1 | UH1 | UH1 | UH1 | UH1 | UH2 | UH2 | B1 | B1 | B1 | B1 | B1 | B2 | B2 | B2 | B2 | BMG5 | BMG5 | BMG5 | MAHB | MAHB | MAHB | MAHB | MAHB | MAHB | DORIS/Mark | DORIS/Mark | DORIS/Mark | DORIS/Mark | DORIS/Mark | ||
|---|---|---|---|---|---|---|---|---|---|---|---|---|---|---|---|---|---|---|---|---|---|---|---|---|---|---|---|---|---|---|---|---|---|---|---|---|---|
| End point | UH2 | UH3 | B1 | B2 | BMG5 | DORIS/Mark | DORIS North | DORIS South | DORIS East | DORIS West | DORIS/Mark | NCP41 | DORIS/Mark | B2 | BMG5 | UH2 | NCP41 | DORIS/Mark | BMG5 | UH2 | NCP41 | DORIS/Mark | UH2 | NCP41 | DORIS/Mark | B1 | B2 | BMG5 | UH2 | NCP41 | B1 | B2 | BMG5 | UH2 | NCP41 | ||
| Distance (m) | ---- | ---- | ---- | ---- | ---- | ---- | ---- | ---- | ---- | ---- | 325 | 1857 | 6 | 23 | 38 | 330 | 1539 | 24 | 26 | 323 | 1541 | 35 | 297 | 1566 | 1 | 8 | 25 | 34 | 324 | 1546 | 6 | 24 | 35 | 325 | 1545 | ||
| Height difference (m) | Campaign 1 | 2001-06-20 | -0.0620 ± 0.01 | -0.9110 ± 0.01 | -0.1330 ± 0.01 | -0.6820 ± 0.01 | -0.8310 ± 0.01 | 0.0270 ± 0.01 | 0.0280 ± 0.01 | 0.0250 ± 0.01 | 0.0260 ± 0.01 | 0.0270 ± 0.01 | 0.0890 ± 0.001 | -0.0500 ± 0.01 | 0.1600 ± 0.001 | -0.5440 ± 0.01 | -0.6980 ± 0.01 | 0.0790 ± 0.01 | 0.0290 ± 0.01 | 0.7090 ± 0.001 | -0.1540 ± 0.01 | 0.6230 ± 0.01 | 0.5730 ± 0.01 | 0.8580 ± 0.001 | 0.7770 ± 0.01 | 0.7270 ± 0.01 | -2.4220 ± 0.001 | -2.5820 ± 0.01 | -3.1260 ± 0.01 | -3.2800 ± 0.01 | -2.5030 ± 0.01 | -2.5530 ± 0.01 | -0.1600 ± 0.01 | -0.7040 ± 0.01 | -0.8580 ± 0.01 | -0.0810 ± 0.01 | -0.1310 ± 0.01 |
| Height difference evolution graph |  |  |  |  |  |  |  |  |  |  |  |  |  |  |  |  |  |  |  |  |  |  |  |  |  |  |  |  |  |  |  |  |  |  |  | ||
Download leveling data
TIDE GAUGE LOCAL LEVELING NETWORK DATA OF STATION Seychelles
-----------------------------------------------------------------------------------------------------
Benchmark Lat. Long. Height Year of determination St.dev Distance_to_TG
10chr (°) 14chr (°) 14chr (m) 10chr 22chr (m)10chr (m) 10chr
-----------------------------------------------------------------------------------------------------
UH1 ---- ---- 9.064 2001 0.00000 ----
UH2 -4.676343 55.529318 9.002 2001 0.01000 5550
UH3 ---- ---- 8.153 2001 0.01000 ----
B1 -4.678893 55.530870 8.923 2001 0.01500 5740
B2 -4.678931 55.530671 8.379 2001 0.01800 5720
BMG5 -4.678714 55.530581 8.225 2001 0.02000 5710
MAHB -4.678825 55.530870 11.505 2001 0.02300 5740
DORIS/Mark-4.678835 55.530870 9.083 2001 0.02300 5740
NCP41 -4.692379 55.534305 8.952 2001 0.02500 6430
DORIS Nort ---- ---- 9.092 2001 0.01000 ----
DORIS Sout ---- ---- 9.089 2001 0.01000 ----
DORIS East ---- ---- 9.090 2001 0.01000 ----
DORIS West ---- ---- 9.091 2001 0.01000 ----
Co-located instruments
- GPS : Seychelles (SEY1)
- Doris : MAHE (MAIB)
- Tide Gauge : POINTE LARUE (MAHPL)
- GPS : MAHE (SEYG)
- GPS : Seychelles (SEY2)
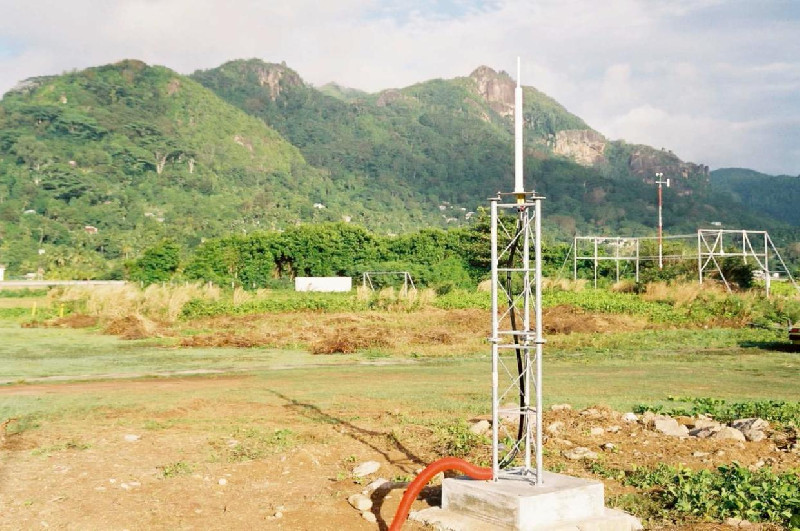
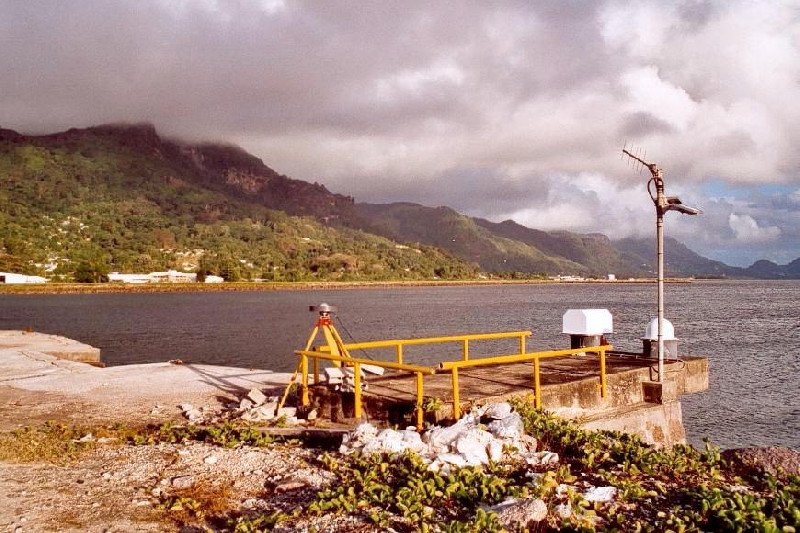
Photo album