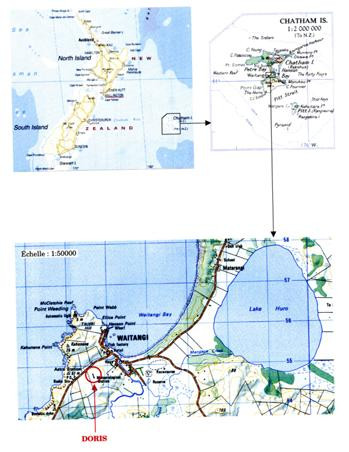
LEVELING OF CHATHAM ISLAND
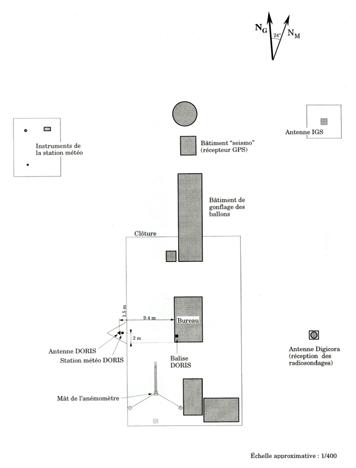
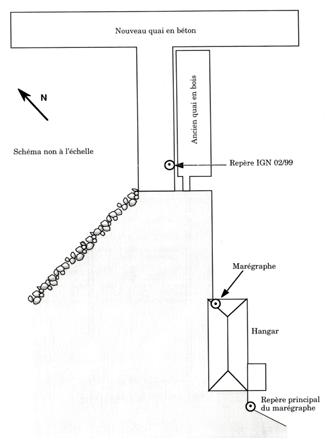
Benchmark positionning related to the tide gauge station
Benchmarks description table
Benchmarks vertical positionning diagram
Reference:
Leveling evolution
| Stand point | TGBM | DORI | DORI | DORI | DORI | CHAT | CHAT | CHAT | CHAT | CHAB | CHAB | TIDE | ||
|---|---|---|---|---|---|---|---|---|---|---|---|---|---|---|
| End point | TIDE | 5503 | CHAT | CHAB | TIDE | 5503 | DORI | CHAB | TIDE | TIDE | 5503 | 5503 | ||
| Distance (m) | ---- | 45 | 61 | 0 | 1241 | 54 | 61 | 61 | 1185 | 1241 | 45 | 1236 | ||
| Height difference (m) | Campaign 1 | 1999-02-27 | 0.7950 ± 0.001 | 1.1250 ± 0.01 | -0.0864 ± 0.001 | 2.4300 ± 0.001 | -44.8650 ± 0.01 | 1.2110 ± 0.01 | 0.0860 ± 0.01 | 2.5160 ± 0.01 | -44.7790 ± 0.01 | -47.2950 ± 0.01 | -1.3050 ± 0.01 | 45.9900 ± 0.01 |
| Height difference evolution graph |  |  |  |  |  |  |  |  |  |  |  |  | ||
Download leveling data
TIDE GAUGE LOCAL LEVELING NETWORK DATA OF STATION Chatham Island
-----------------------------------------------------------------------------------------------------
Benchmark Lat. Long. Height Year of determination St.dev Distance_to_TG
10chr (°) 14chr (°) 14chr (m) 10chr 22chr (m)10chr (m) 10chr
-----------------------------------------------------------------------------------------------------
CHAT -43.955788 -176.565838 54.429 1999 0.01000 10
DORI -43.956167 -176.566396 54.515 1999 0.01500 50
CHAB -43.956167 -176.566396 56.945 1999 0.01500 50
TIDE -43.945909 -176.560264 9.650 1999 0.00000 1190
5503 -43.956275 -176.565856 55.640 1999 0.01800 50
TGBM ---- ---- 8.855 1999 0.00100 ----
Co-located instruments
- GPS : Chatham Island (CHAT)
- Doris : CHATHAM ISLAND (CHAB)
- Tide Gauge : CHATHAM ISLAND (CHATH)
- GPS : Chatham Island (CHTI)
- GPS : Owenga (OWNG)
- GPS : Chatham Island - Owenga (OWMG)
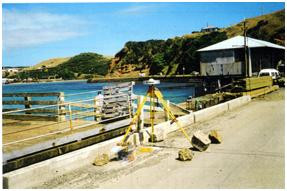
Photo album