

New tools on SONEL and design of the homepage
Since the last GLOSS group of experts meeting, the SONEL team at ULR has been working on making the GPS products at tide gauges more readily accessible. A first step towards this goal has been realized by 1 redesigning the homepage, and 2 by providing new tools to display the GPS position time series with options such as including or not the velocity, the annual cycle or the (detected) offsets.
Contacts :
Mikaël Guichard, IT Engineer
Médéric Gravelle, Research Engineer
Briefly :
The first important change concerns the homepage. A new panel called "Sea and land levels at the coast" has been created and linked to the GPS solutions page. The organization of the data in the GPS solutions page is currently under review. An important perspective is to provide combined products from the GPS and the tide gauge data analyses such as absolute (geocentric) rates of sea level change. This perspective is worked out with our colleagues from the PSMSL where relative (with respect to the coast) rates of sea level change can already be retrieved from the sole analyses of the tide gauge data.
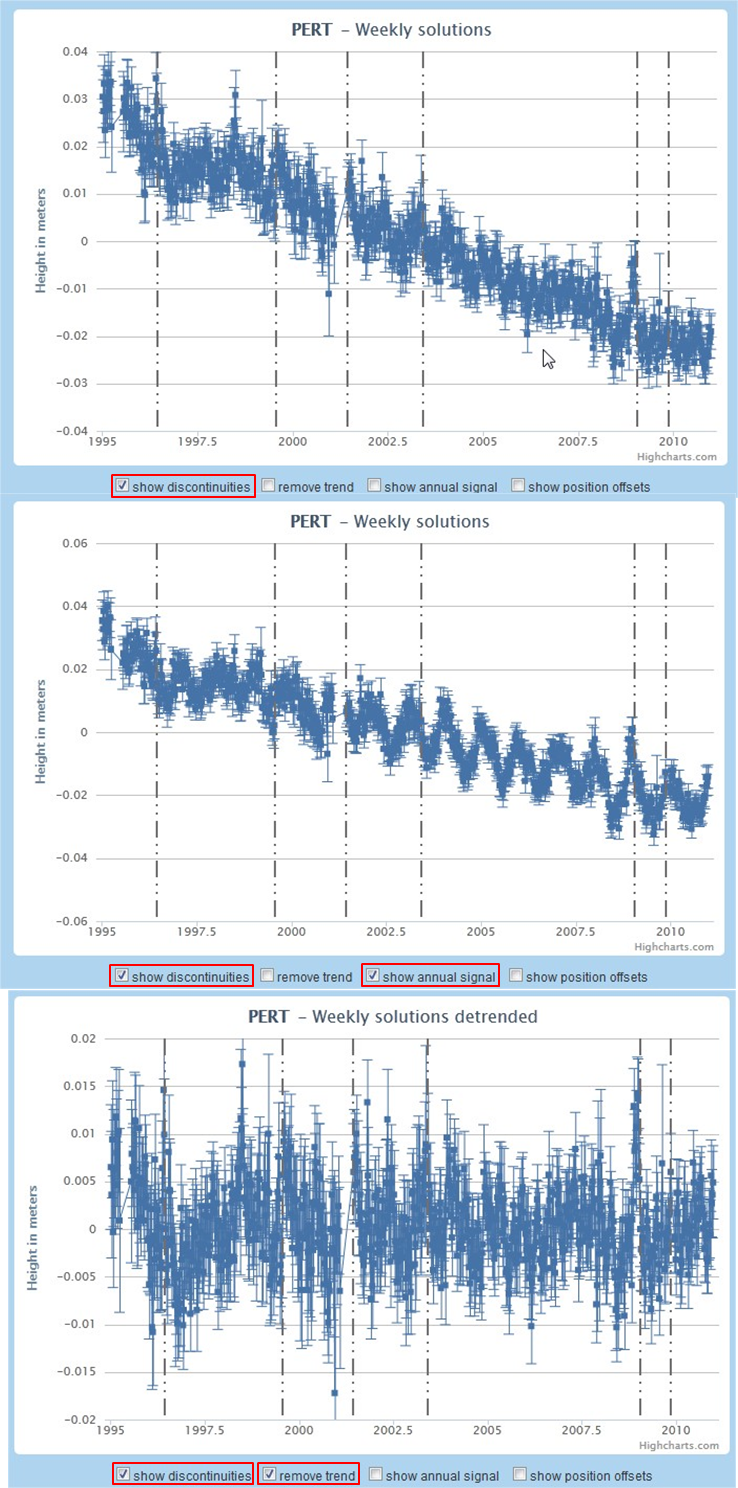
Most useful for the analysts, a new tool has been developed to display the GPS position time series. The user can now choose different options such as removing or not the linear trend (velocity), the seasonal signal (annual) or the detected offsets. Consistently, the GPS position data file that can be downloaded is in agreement with the chosen options of display. For example, if the "remove trend" option has been ticked, then the associated data file for downloading will not content the linear trend. The Figure on the right shows various possible options or combination of options for the Perth GPS station (click on the link to access that station and test the various options). This tool may provide substantial help to the analyst for a better understanding and interpretation of the observed signals at a particular station, its noise and overall quality.


