

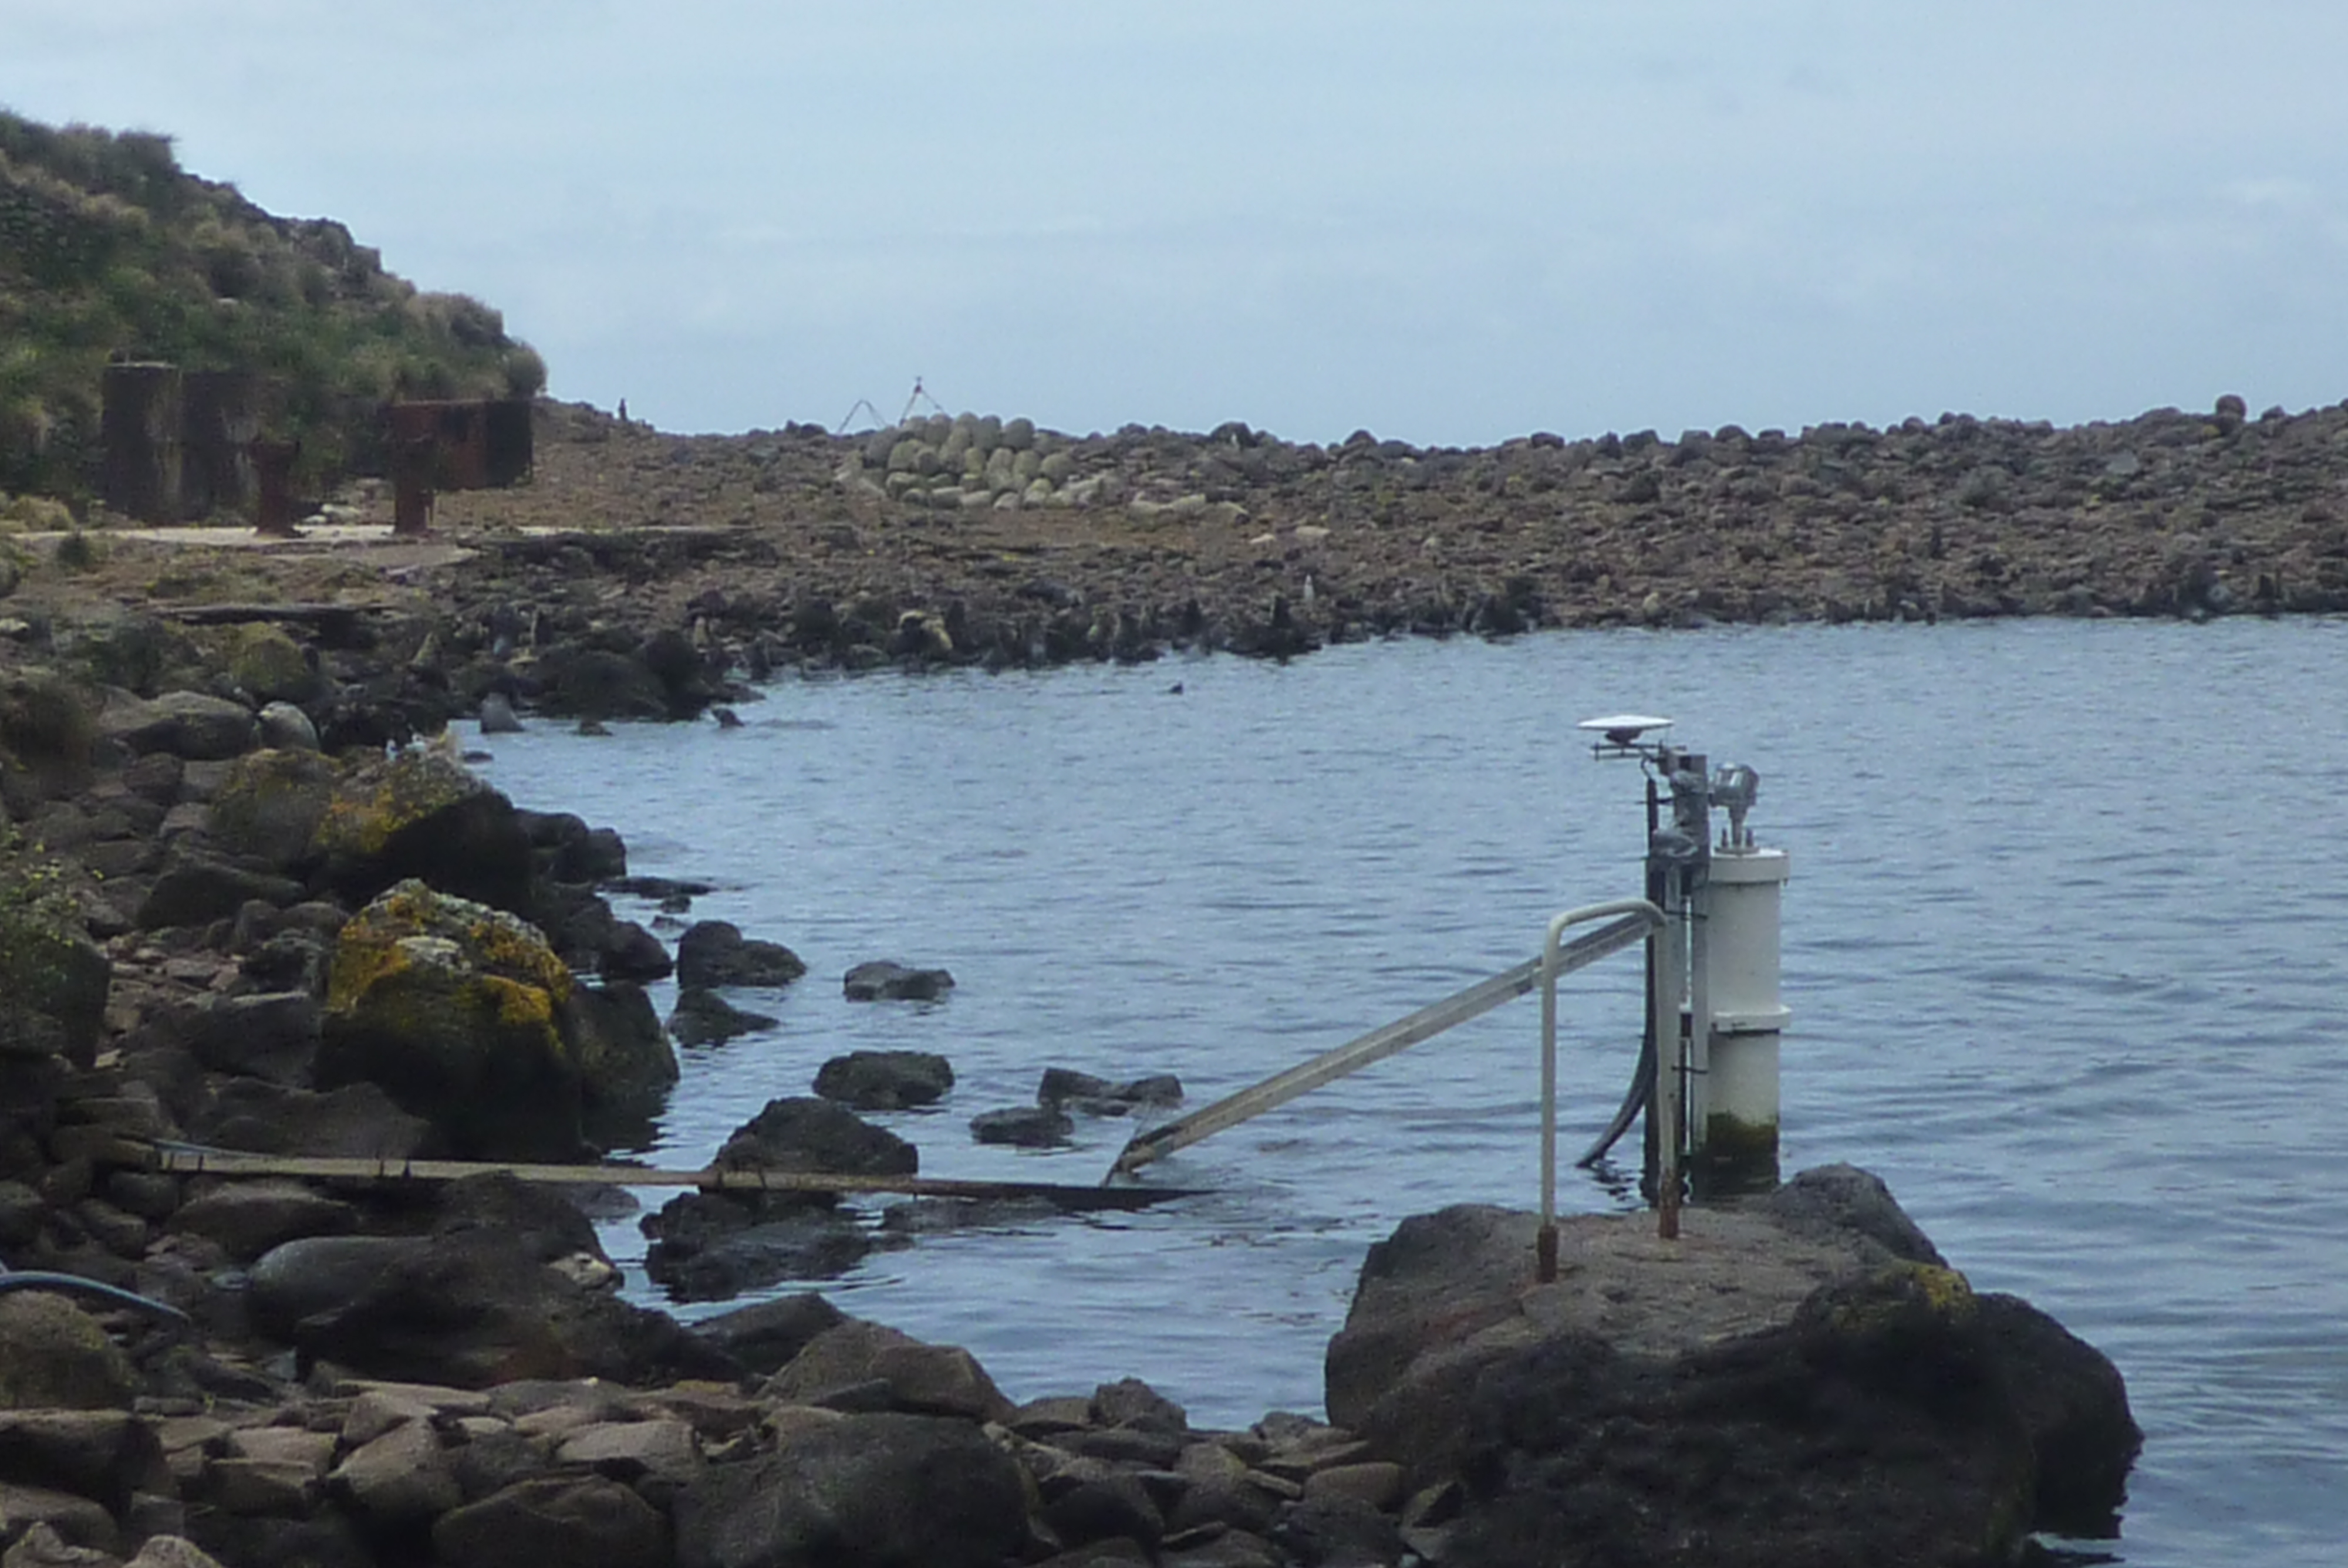
Permanent GPS station at the Saint-Paul island tide gauge, Indian Ocean
Researchers from the LEGOS joint research unit (UMR5566, CNRS/Toulouse) in collaboration with the DT/INSU (UPS 855 CNRS/Brest) have installed a permanent GPS station at the Saint-Paul Island (38°41’S - 77°31 E) in the South Indian Ocean, on the GLOSS tide gauge site during the last NIVMER campaign. This installation was done in the framework of the French ROSAME sea level network. It aims at better constraining and explaining the recent estimation of relative sea level trend observed at this site, which is not significantly different from zero.
Source: S. Calmant & Fichen, L., 2012.
NIVMER12 campaign.
Contact:
Laurent Testut (UMR LEGOS)
Tel. 05 61 33 27 85
Main results:
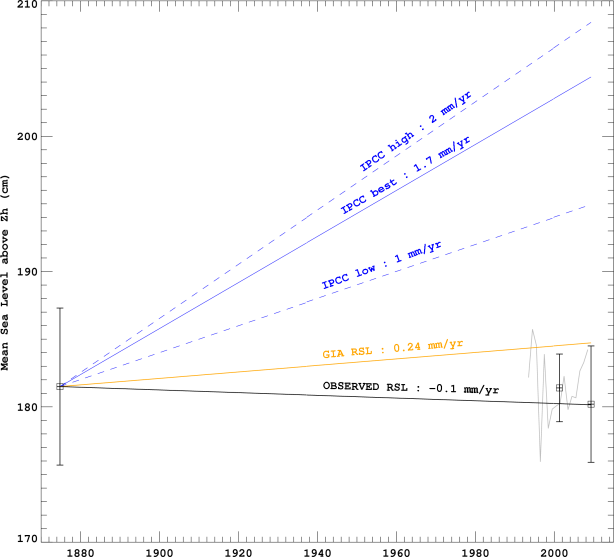
A data archaeology exercise was carried out on ancient sea level observations recorded during the transit of Venus across the Sun observed in 1874 from Saint-Paul Island, 38°41’S - 77°31 E, in the Southern Indian Ocean (Testut et al. 2010). Historical (1874) and recent (1994-2009) sea level observations were assembled into a consistent time series. A thorough check of the data and its precise geodetic connection to the same datum was only possible thanks to the recent installation of new technologies (GPS buoy and radar tide gauge sensor) and levelling campaigns. The estimated rate of relative sea level change, spanning the last 135 years at Saint-Paul, was not significantly different from zero (-0.1 ± 0.3 mm/yr), a value which could be reconciled with average global estimates of 1.7 mm/yr assuming the DORIS vertical velocity estimate at the nearby Amsterdam Island could be applied to correct for the land motion at the tide gauge (Altamimi and Collilieux, 2010). Considering the scarcity of long-term sea level data in the Southern Hemisphere, the exercise provides an invaluable additional observational constraint for further investigations of geographical sea level rise patterns.
Figure 1. (right) MSL estimates at Saint-Paul relative to the hydrographic zero for the historic observations (1874) and the recent observations (2009). The error bars indicate the uncertainty of the estimates. The grey curve is the annual mean altimetric sea level at Saint-Paul Island from AVISO product and the associated MSL is shown over the period as a rough guide. The orange line shows the GIA-induced relative sea level change rate, and the blue lines indicate the lower, upper and best global sea level trend estimate over the 20th century.
The data from the permanent GPS station that has been installed will provide an invaluable estimate of the Island vertical land movement. This information is critical to better interpret the rather astonishing result of no relative sea level elevation during the past 135 years. It will also be usefull for geodynamic studies on the dormant volcano of Saint-Paul island or on plate tectonics.
References:
– Altamimi Z. and X. Collilieux, 2010. Quality assessment of the IDS contribution to ITRF2008. Advances in Space Research, 45(12), 1500-1509.
– Testut L., B. Martin Miguez, G. Wöppelmann, P. Tiphaneau, N. Pouvreau, M. Karpytchev, 2010.The sea level at Saint-Paul, Southern Indian Ocean, from 1874 to the present. Journal of Geophysical Research, 115, C12028, doi:10.1029/2010JC006404.


