
LEVELING OF ROSCOFF
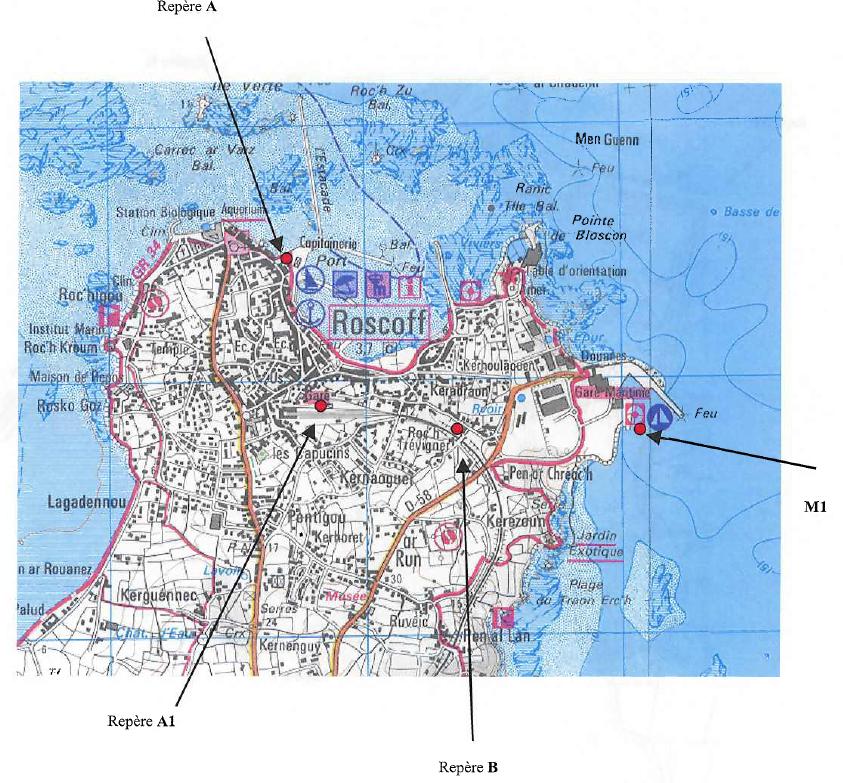
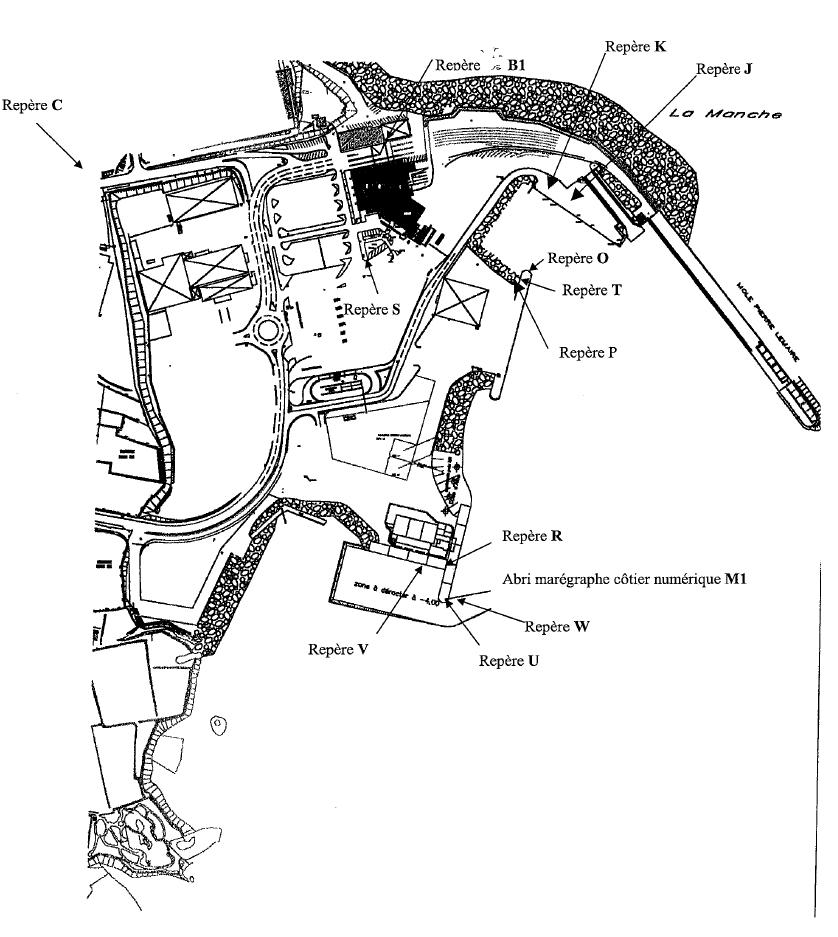
Benchmark positionning related to the tide gauge station
Benchmarks description table
Benchmarks vertical positionning diagram
Reference:
Leveling evolution
| Stand point | P | P | P | R | R | R | Z | Z | W | Y | S | S | O | T | T | T | T | B1 | ||
|---|---|---|---|---|---|---|---|---|---|---|---|---|---|---|---|---|---|---|---|---|
| End point | T | R | A | W | V | U | W | Y | L | ROTG_ARP | B1 | T | T | V | R | K | J | C | ||
| Distance (m) | ---- | ---- | 1420 | ---- | ---- | ---- | 35 | ---- | 27 | ---- | ---- | ---- | ---- | ---- | ---- | ---- | ---- | 1526 | ||
| Height difference (m) | Campaign 5 | 2025-06-19 | --- | --- | --- | --- | --- | --- | --- | --- | --- | --- | --- | --- | --- | --- | --- | --- | --- | --- |
| Campaign 4 | 2020-12-16 | --- | --- | --- | --- | --- | --- | --- | --- | --- | --- | --- | --- | --- | --- | --- | --- | --- | --- | |
| Campaign 3 | 2015-06-18 | --- | --- | --- | --- | --- | --- | --- | --- | --- | --- | --- | --- | --- | --- | --- | --- | --- | --- | |
| Campaign 2 | 2009-08-25 | 0.2291 ± 0.0001 | 0.5783 ± 0.0015 | 2.7230 ± 0.001 | 0.0390 ± 0.0001 | --- | --- | 0.0139 ± 0.0001 | 3.0398 ± 0.0001 | 1.3189 ± 0.0001 | 0.0496 ± 0.0001 | --- | --- | --- | --- | --- | --- | --- | --- | |
| Campaign 1 | 2005-04-14 | --- | --- | --- | 0.0390 ± 0.001 | 0.0150 ± 0.001 | 0.2500 ± 0.001 | --- | --- | --- | --- | 0.5530 ± 0.001 | 0.1520 ± 0.001 | 0.0130 ± 0.001 | 0.3660 ± 0.001 | 0.3510 ± 0.001 | 0.5500 ± 0.001 | 0.2130 ± 0.001 | 14.1790 ± 0.001 | |
| Height difference evolution graph |  |  |  |  |  |  |  |  |  |  |  |  |  |  |  |  |  |  | ||
Download leveling data
TIDE GAUGE LOCAL LEVELING NETWORK DATA OF STATION ROSCOFF
-----------------------------------------------------------------------------------------------------
Benchmark Lat. Long. Height Year of determination St.dev Distance_to_TG
10chr (°) 14chr (°) 14chr (m) 10chr 22chr (m)10chr (m) 10chr
-----------------------------------------------------------------------------------------------------
A 48.725750 -3.983111 14.700 2025 0.00000 1520
A1 48.720556 -3.983167 19.241 2025 0.00100 1310
B 48.720722 -3.977306 19.646 2005 0.00000 890
B1 48.721850 -3.950283 12.607 2025 0.00100 1190
C 48.721500 -3.971017 26.786 2025 0.00100 520
J ---- ---- 12.418 2025 0.00100 ----
K ---- ---- 12.755 2025 0.00100 ----
O ---- ---- 12.192 2005 0.00100 ----
P 48.721167 -3.965100 11.977 2025 0.00100 310
R ---- ---- 12.547 2025 0.00200 ----
S ---- ---- 12.053 2025 0.00100 ----
T ---- ---- 12.205 2025 0.00100 ----
U ---- ---- 12.797 2025 0.00200 ----
V 48.721233 -3.965050 12.561 2025 0.00200 310
W 48.718767 -3.965483 12.585 2025 0.00200 40
L 48.718533 -3.965600 13.913 2009 0.00200 10
Y ---- ---- 15.796 2020 0.00100 ----
Z 48.718483 -3.965683 12.572 2025 0.00200 0
ROTG_ARP 48.718483 -3.965683 15.670 2009 0.00200 0
N.R.K3Y3-1 ---- ---- 11.722 2025 0.00100 ----
U' ---- ---- 12.791 2025 0.00200 ----
X ---- ---- 26.994 2015 0.00200 ----
C1 ---- ---- 13.904 2025 0.00200 ----
D1 ---- ---- 15.604 2025 0.00200 ----


