
LEVELING OF BREST
Benchmark positionning related to the tide gauge station
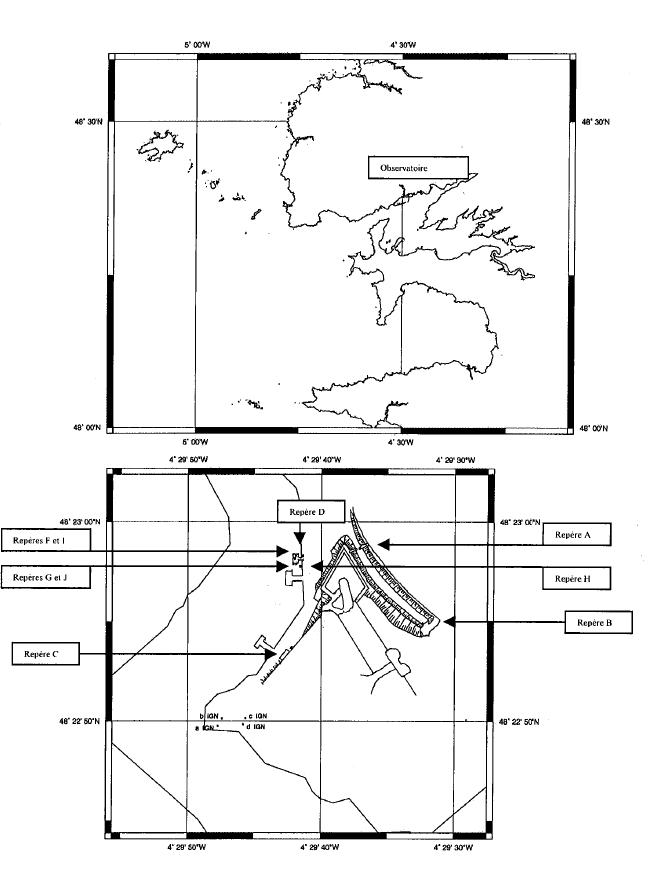
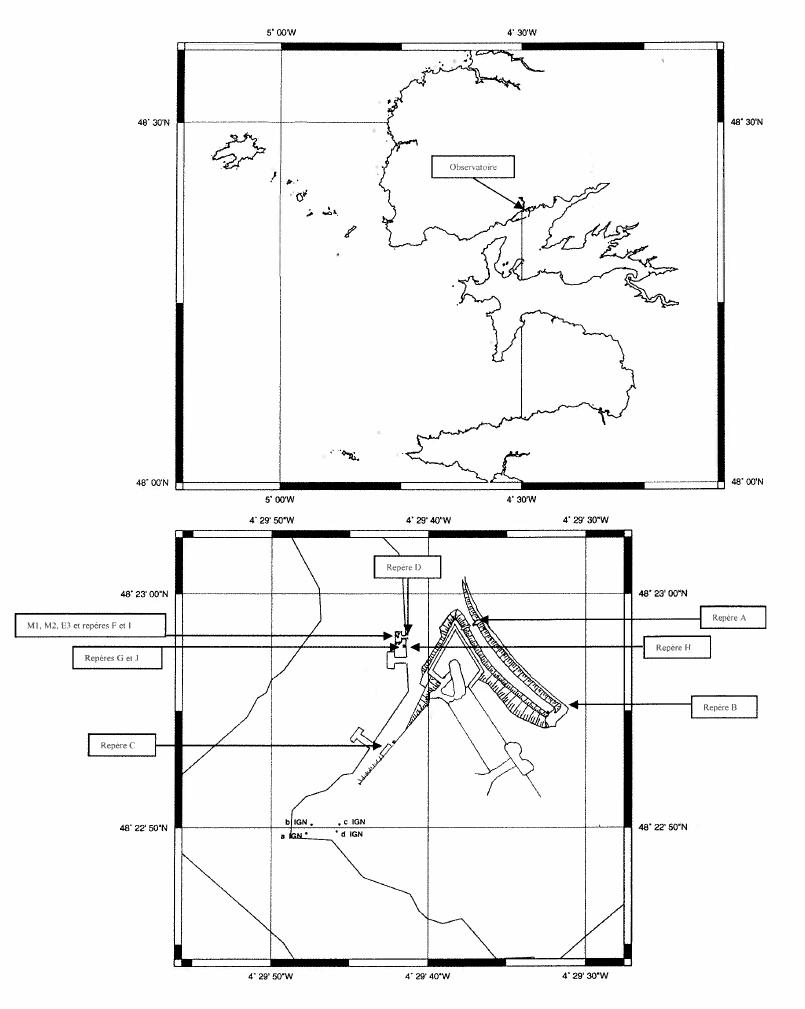
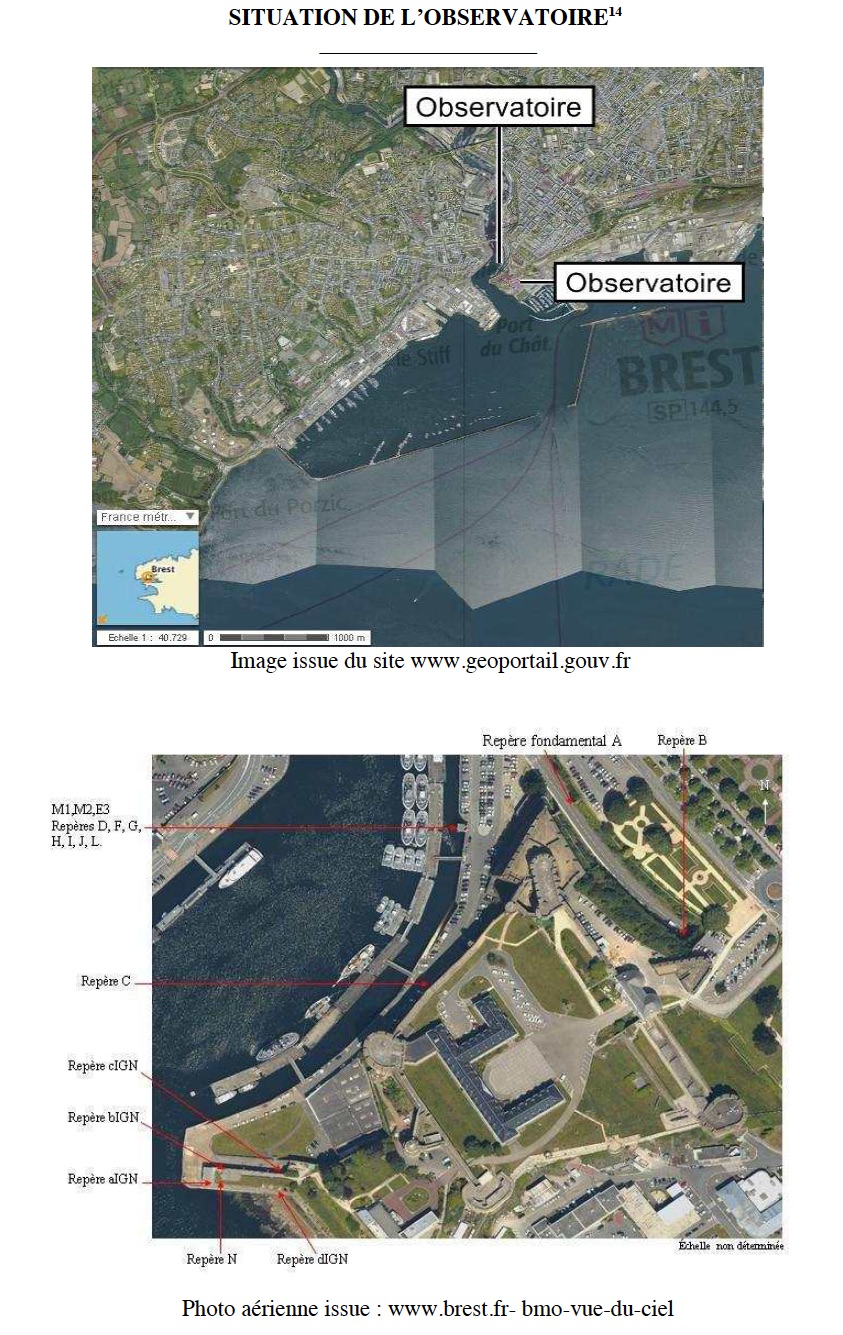
Benchmarks description table
Benchmarks vertical positionning diagram
Reference:
Leveling evolution
| Stand point | cIGN | cIGN | cIGN | cIGN | C | C | A | A | A | A | A | A | A | L | I | D | D | D | D | H | H | G | G | J | J | bIGN | ||
|---|---|---|---|---|---|---|---|---|---|---|---|---|---|---|---|---|---|---|---|---|---|---|---|---|---|---|---|---|
| End point | bIGN | dIGN | N | aIGN | cIGN | A | B | G | H | A | C | D | F | A | A | F | A | I | C | D | C | A | D | A | D | dIGN | ||
| Distance (m) | ---- | ---- | ---- | ---- | ---- | ---- | ---- | ---- | ---- | ---- | ---- | ---- | ---- | ---- | ---- | ---- | ---- | ---- | ---- | ---- | ---- | ---- | ---- | ---- | ---- | ---- | ||
| Height difference (m) | Campaign 7 | 2024-04-18 | --- | --- | --- | --- | --- | --- | --- | --- | --- | --- | --- | --- | --- | --- | --- | --- | --- | --- | --- | --- | --- | --- | --- | --- | --- | --- |
| Campaign 6 | 2018-06-21 | --- | --- | --- | --- | --- | --- | --- | --- | --- | --- | --- | --- | --- | --- | --- | --- | --- | --- | --- | --- | --- | --- | --- | --- | --- | --- | |
| Campaign 5 | 2013-07-02 | 0.0170 ± 0.001 | 0.0960 ± 0.001 | 0.1000 ± 0.001 | 0.0370 ± 0.001 | 9.3010 ± 0.001 | 0.1090 ± 0.001 | 0.0820 ± 0.001 | --- | --- | --- | --- | --- | --- | 0.6220 ± 0.001 | 0.6260 ± 0.001 | 0.2980 ± 0.001 | 1.0780 ± 0.001 | --- | --- | 1.1730 ± 0.001 | --- | 1.7340 ± 0.001 | --- | 2.0840 ± 0.001 | --- | --- | |
| Campaign 4 | 2006-04-03 | --- | 0.0960 ± 0.001 | --- | --- | 9.3010 ± 0.001 | --- | 0.0810 ± 0.001 | --- | --- | --- | --- | --- | --- | --- | 0.6270 ± 0.001 | 0.3000 ± 0.001 | 1.0790 ± 0.001 | 0.4520 ± 0.001 | --- | 1.1720 ± 0.001 | 2.1430 ± 0.001 | --- | 0.6540 ± 0.001 | --- | 1.0050 ± 0.001 | 0.0780 ± 0.001 | |
| Campaign 3 | 2002-03-04 | --- | 0.0950 ± 0.001 | --- | --- | 9.2990 ± 0.001 | 0.1080 ± 0.001 | 0.0770 ± 0.001 | --- | --- | --- | --- | --- | --- | --- | --- | 0.3010 ± 0.001 | 1.0810 ± 0.001 | 0.4540 ± 0.001 | 0.9730 ± 0.001 | 1.1700 ± 0.001 | --- | --- | 0.6530 ± 0.001 | --- | 1.0050 ± 0.001 | --- | |
| Campaign 2 | 1996-06-30 | --- | --- | --- | --- | --- | --- | 0.0800 | -1.7380 | -2.2520 | --- | --- | --- | --- | --- | --- | --- | --- | --- | --- | --- | --- | --- | --- | --- | --- | --- | |
| Campaign 1 | 1993-10-01 | --- | --- | --- | --- | --- | --- | --- | --- | --- | 9.5410 | 9.4330 ± 0.001 | 8.4570 ± 0.001 | 8.7600 ± 0.001 | --- | --- | --- | --- | --- | --- | --- | --- | --- | --- | --- | --- | --- | |
| Height difference evolution graph |  |  |  |  |  |  |  |  |  |  |  |  |  |  |  |  |  |  |  |  |  |  |  |  |  |  | ||
Download leveling data
TIDE GAUGE LOCAL LEVELING NETWORK DATA OF STATION Brest
-----------------------------------------------------------------------------------------------------
Benchmark Lat. Long. Height Year of determination St.dev Distance_to_TG
10chr (°) 14chr (°) 14chr (m) 10chr 22chr (m)10chr (m) 10chr
-----------------------------------------------------------------------------------------------------
A ---- ---- 12.500 2024 0.00000 ----
B ---- ---- 12.581 2024 0.00100 ----
C ---- ---- 12.392 2024 0.00100 ----
D ---- ---- 11.426 2024 0.00100 ----
F ---- ---- 11.722 2024 0.00100 ----
G ---- ---- 10.767 2024 0.00100 ----
H ---- ---- 10.250 2024 0.00100 ----
I ---- ---- 11.876 2024 0.00100 ----
J ---- ---- 10.416 2013 0.00100 ----
aIGN ---- ---- 21.733 2024 0.00200 ----
bIGN ---- ---- 21.710 2024 0.00100 ----
cIGN ---- ---- 21.697 2024 0.00200 ----
dIGN ---- ---- 21.792 2024 0.00100 ----
L ---- ---- 11.880 2024 0.00100 ----
N ---- ---- 21.797 2024 0.00100 ----
O ---- ---- 11.904 2024 0.00100 ----
K ---- ---- ---- ---- ---- ----
Co-located instruments
- GPS : Brest (BRST)
- Tide Gauge : BREST (BREST)
- GPS : Guipavas (GUIP)
- GPS : Bourg Blanc (BGBC)


